- UK inflation fell to the 2% BoE target for the first time in almost three years.
- UK services price inflation increased by 5.7%, more significant than the forecast 5.5%.
- US data on Tuesday showed soft retail sales in May.
The GBP/USD forecast shows a surge in bullish momentum after data from the UK showed that underlying inflation remains strong. Meanwhile, data in the previous session revealed a smaller-than-expected increase in US retail sales.
–Are you interested in learning more about Bitcoin price prediction? Check our detailed guide-
Data on Wednesday showed that UK inflation fell to the 2% BoE target for the first time in almost three years. However, underlying price pressures remained strong, with service price inflation increasing by 5.7%, which was more significant than the forecast of 5.5%. Consequently, the Bank of England might hesitate to lower borrowing costs.
While economists expect the BoE to start cutting rates in August, markets have lowered the likelihood of such an outcome from 50% before the report to 30%. At the same time, they now expect 44 basis points of cuts this year, down from 50. The shift to a less dovish outlook helped boost the pound on Wednesday.
Meanwhile, the dollar was on the back foot after US data on Tuesday showed soft retail sales in May. Economists had expected a more significant increase in sales for the month. The miss indicated weaker consumer spending and demand.
As the US consumer reduces spending, the economy suffers, and inflation declines. As a result, investors believe the Fed has more reading to cut borrowing costs. For this reason, there is a 67% chance that the central bank will cut rates in September.
GBP/USD key events today
Investors will keep digesting inflation data as they await tomorrow’s Bank of England policy meeting.
GBP/USD technical forecast: Rebound meets strong SMA and Fib resistance
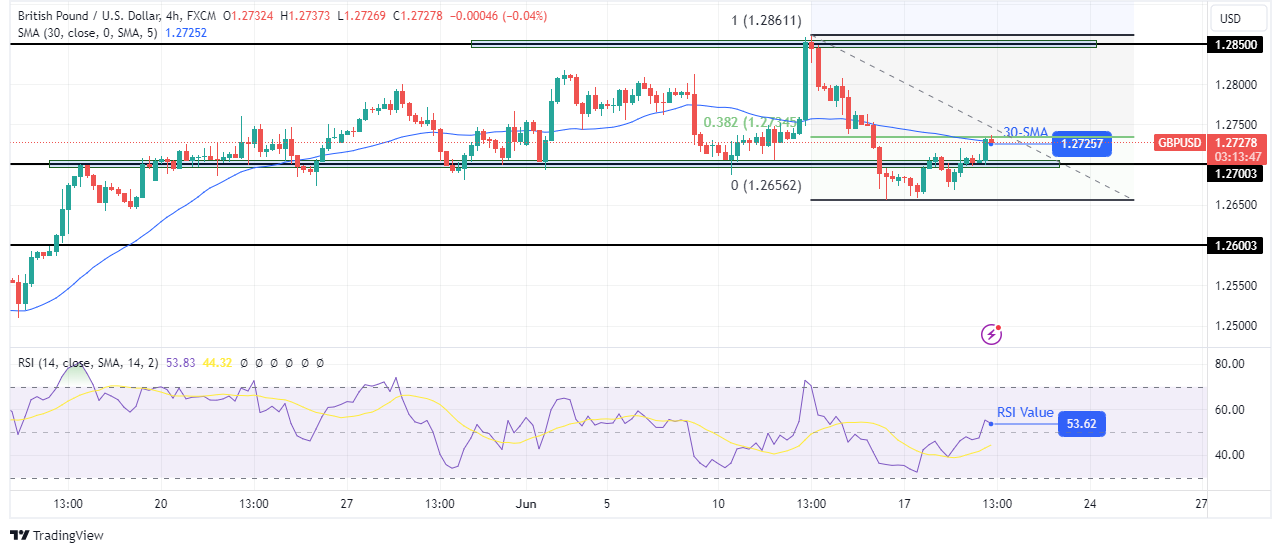
On the technical side, the GBP/USD price moved sharply from the 1.2700 key level to the 30-SMA resistance. However, the bias has yet to shift from bearish to bullish since the price is still testing the SMA resistance and the 0.382 Fib level. Nevertheless, bulls have gained momentum, as seen in the RSI, which has reached above 50.
–Are you interested in learning more about forex basics? Check our detailed guide-
Therefore, they may breach the SMA to retest the 1.2850 resistance level. However, there is a higher chance the SMA and the Fib level will hold firm, allowing bears to return and target the 1.2600 level.
Looking to trade forex now? Invest at eToro!
68% of retail investor accounts lose money when trading CFDs with this provider. You should consider whether you can afford to take the high risk of losing your money.
