- The UK labor market showed resilience, with jobless claims plunging.
- US data showed higher-than-expected consumer and producer prices.
- Experts believe the US central bank will cut rates by 25 bps.
The GBP/USD weekly forecast supports a bullish trend as the FOMC meeting could lead to further weakness for the greenback.
Ups and downs of GBP/USD
The GBP/USD pair had a bullish week after a mix of UK and US economic reports. Notably, the UK labor market showed resilience, with jobless claims plunging. Meanwhile, the economy stagnated, with no growth, indicating a weaker-than-expected recovery.
–Are you interested in learning more about STP brokers? Check our detailed guide-
On the other hand, US data showed higher-than-expected consumer and producer prices, reducing the likelihood of a super-sized rate cut. Consequently, the dollar rose. However, this changed late on Thursday after reports indicated that a 50 bps rate cut was a close call. The dollar dropped, allowing the pound to close on a bullish candle.
Next week’s key events for GBP/USD
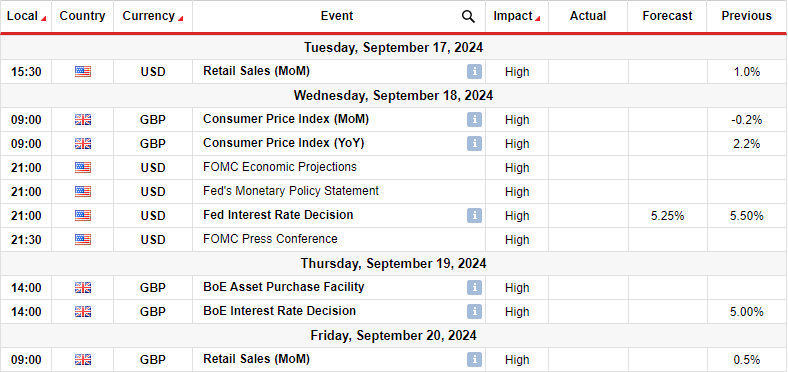
Next week, high-impact UK events will include the consumer inflation and retail sales reports and the Bank of England policy meeting. Meanwhile, in the US, the market will focus on the FOMC meeting and retail sales data.
Experts believe the US central bank will cut rates by 25 bps. However, there is still uncertainty regarding this, as some expect a more significant cut. Therefore, there might be a lot of volatility in the markets on Wednesday. Meanwhile, the Bank of England might keep rates unchanged owing to recent better-than-expected economic data. However, this outlook might change if inflation eases more than expected.
GBP/USD weekly technical forecast: Bulls resurface at solid support zone

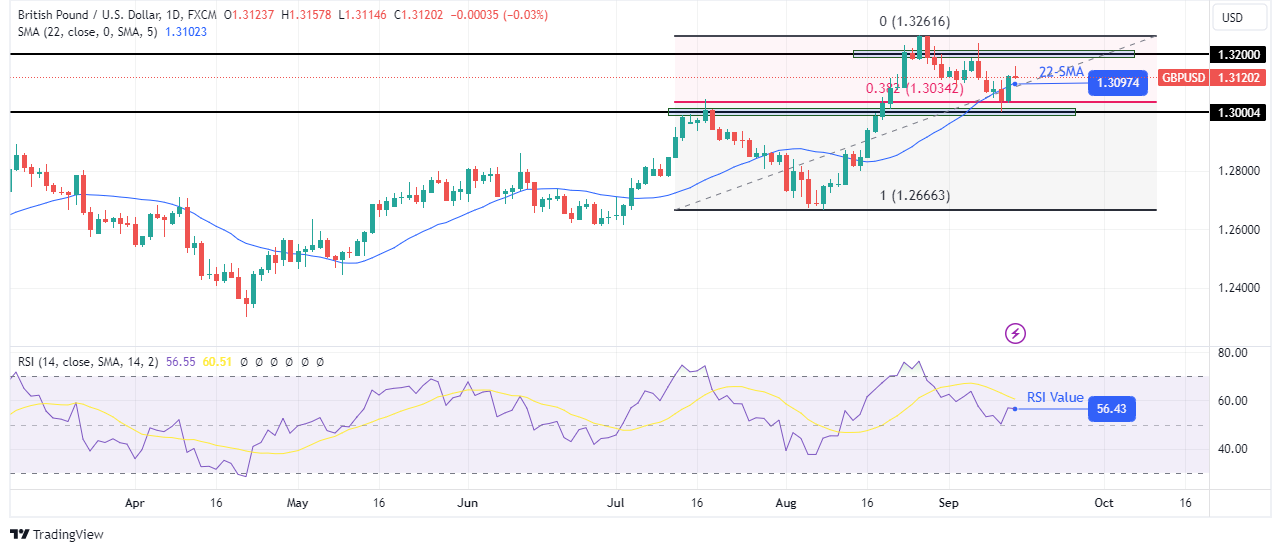
On the technical side, the GBP/USD price is on a developed bullish trend, with higher highs and higher lows. At the same time, the price has traded mostly above the 22-SMA, a sign that bulls are in the lead. Meanwhile, the RSI has traded in bullish territory, touching the overbought region several times.
–Are you interested in learning more about forex robots? Check our detailed guide-
The uptrend recently reached the 1.3200 critical resistance level, but the price failed to sustain a move above it. Consequently, bears took charge, triggering a pullback to the 22-SMA support. The SMA coincided with the 1.3000 psychological level and the 0.382 Fib, creating a solid support zone. The price has made a strong bullish candle that shows it might bounce higher to retest the 1.3200 level. A higher high will strengthen the bullish bias.
Looking to trade forex now? Invest at eToro!
68% of retail investor accounts lose money when trading CFDs with this provider. You should consider whether you can afford to take the high risk of losing your money

