- The AUD/USD outlook remains stubbornly bullish, breaking 7-month highs amid broad dollar weakness.
- Dovish Fed and US fiscal deficit concerns weigh on the greenback.
- Delayed tariffs and improved risk sentiment support the Aussie.
The AUD/USD outlook is strongly bullish as the pair extends its winning streak in the new week. The price built on Friday’s rally pierced the key psychological mark of 0.6500. It’s the highest price point since Nov 2024. It shows loss of confidence in the US dollar.
–Are you interested in learning more about Canadian forex brokers? Check our detailed guide-
The Reserve Bank of Australia recently reduced its rates by 25 bps. It’s a dovish move that could deteriorate AUD’s strength. However, inflation data is vital to watch now.
Towering US fiscal concerns dominate the narrative for the US dollar. President Trump’s “Big, Beautiful Bill” passed in the lower house and sent to the Senate. The bill is projected to add $3.8 trillion to the Federal deficit. The fears have heightened about long-term sustainability, triggering a strong sell-off in the Greenback.
Other factors for the US dollar include downbeat US CPI and PPI data, suggesting a slowdown in the price pressure. Also, the Fed’s dovish outlook points at two rate cuts of 25 bps by end of the year. Geopolitics and policy uncertainty, especially around Trump’s tariffs have eroded institutional confidence. Big funds are gradually rotating out of USD asset due to economic instability.
Moreover, the delay of 50% tariffs on EU imports until July 09 has improved the risk sentiment supporting global equities and risk-sensitive currencies like Australian dollar.
Despite the bullish tone, geopolitical worries can limit the Aussie’s upside. China has accuses the US of violating trade agreements by restricting Huawei’s access to Ascend AI chips. China has hinted to retaliate as well.
AUD/USD Key Events Ahead
There is no major data release due today.
AUD/USD Technical Outlook: Bulls Aiming for 0.6680
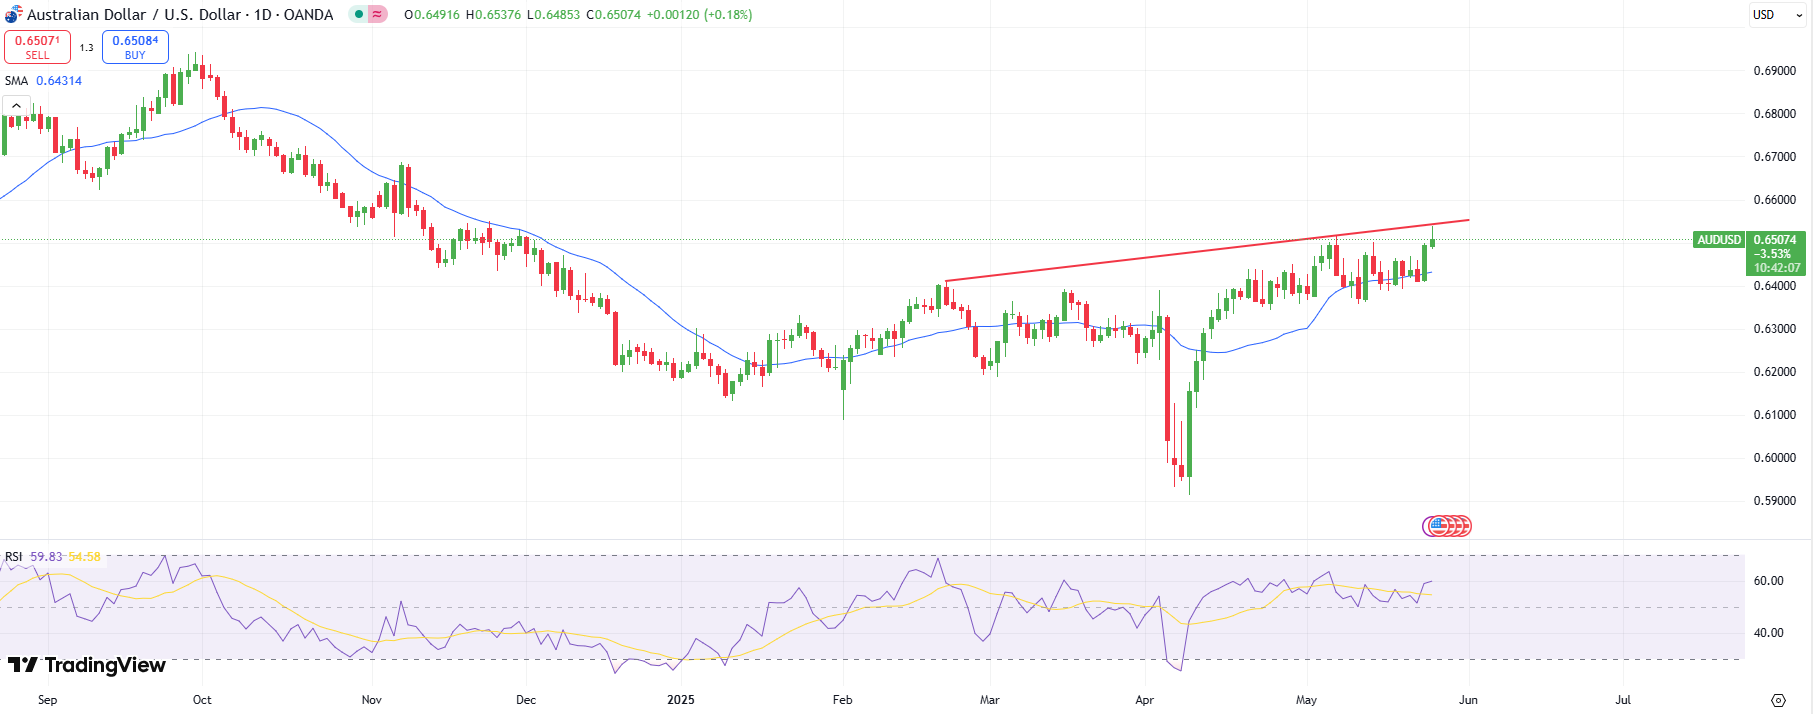
The AUD/USD technical outlook remains bullish on the daily chart. The price is wobbling around the key resistance level of 0.6500. The next resistance level emerges at 0.6680. The downside remains supported by the 20-day SMA at 0.6450.
–Are you interested in learning more about high leveraged brokers? Check our detailed guide-
The 14-day RSI value is around 60.0 which indicates a potential to move further up. Meanwhile, 20-day SMA is also pointing upwards. However, the pair needs to clear the trendline resistance at 0.6573 which is today’s top as well.
Looking to trade forex now? Invest at eToro!
68% of retail investor accounts lose money when trading CFDs with this provider. You should consider whether you can afford to take the high risk of losing your money.
