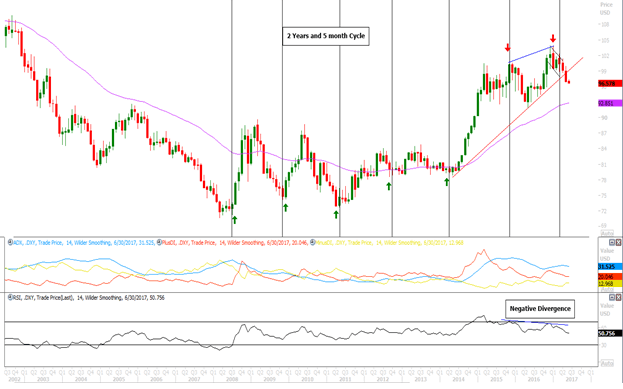
Dollar index monthly chart
Fundamental analysis on Macro US economy
US GDP turned lower to 1.2%. This was the lowest growth rate in a year.
US Non-Farm payroll decelerated despite unemployment rate is at 16-year low of 4.3%
US Service PMI & Non- Manufacturing PMI slowed down, and Factory activity is at 4-month low and Manufacturing PMI dropped to eight-month low.
The trade deficit is running 13.4% higher through the first four months of 2017 compared to the same period a year earlier.
US inflation rate lower than expected at 2.2%. This was the lowest inflation rate so far this year.
Fundamental analysis on US Politics
FBI Director James Comey’s testimony before a Senate committee will release on Thursday, 8th June.
President Trump announced last week the U.S. would withdraw from the Paris climate agreement and “cease all implementation” of the accord.
Technical analysis on dollar index
As seen above in monthly chart, the two years and the 5-month cycle has precisely worked to catch the bottom in last eight years. Now, the same cycle worked to gauge the top and recently in the month of March 2017 it has provided the signal for the top. Furthermore, the index exhibited the negative divergence on momentum oscillator RSI of 14 months. This suggests the weakness in the index.
Conclusion: In future, we might see a spike on the upside in dollar index because of rate hike which is expected in the monetary policy scheduled on 14th June 2017. However, weaker US macroeconomic data and political uncertainty should drag the index lower towards 94.50-94 levels in near term and over medium term it could test 92.
Most benefit currency from the lower dollar would be EUR and JPY. EUR can move higher towards 1.1400-1.1450. JPY could move lower towards 108-107.50.
Modest benefit currency would be GBP, CAD, and INR