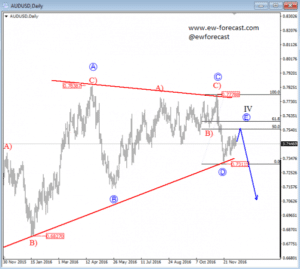
The triangle is still unfolding on the daily chart, currently in final wave E after the price had completed the blue wave D from two weeks ago, around the 0.7312 mark. Ideally, the market will now follow with a final bounce up into wave E of a triangle correction, towards the 50.0 or 61.8 Fibonacci ratio, from where some resistance may come in play and a possible reversal into final wave V of a higher degree can unfold.
AUDUSD, Daily
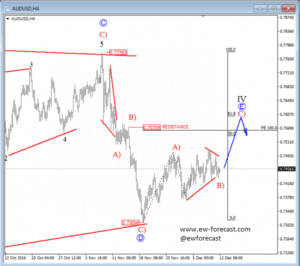
Regarding the 4h chart, we can see that the Aussie has turned down a few weeks back, from 0.7778 to be exact, from where the sharp turn suggests that the pair can still be trapped in a very big Elliott Wave triangle formation visible on a daily chart. If that’s true, then the move down from the start of November was another three-wave decline, as wave D completed at 0.7310 area, so the recent bounce could be part of wave E, final leg in wave IV triangle that can face resistance at 0.7530-0.7600 area, where Fibonacci ratios of 50.0 or 61.8 could come in play. Now, we see the price trading in sub-wave B), after the recent completion of wave A).
AUDUSD, 4H
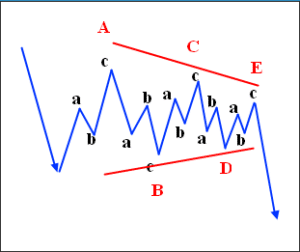
A Triangle is a common 5 wave pattern labeled A-B-C-D-E that moves counter-trend and is corrective in nature. Triangles move within two channel lines drawn from waves A to C, and from waves B to D. A Triangle is either contracting or expanding depending on whether the channel lines are converging or expanding. Triangles are overlapping five wave affairs that subdivide 3-3-3-3-3.
Basic Triangle Pattern: