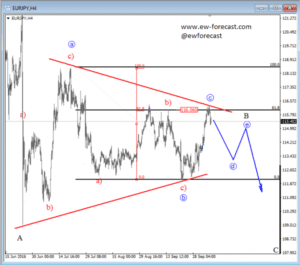
On the 4h chart of EURJPY, we changed our view a little bit after the recent leg up and are now looking at a triangle that is midway through its completion with blue wave c in motion. We think that this blue wave c may find its resistance and its turning point around the 61.8 Fibonacci ratio, from where bears may take over and push the price into sub-wave d.
EURJPY, 4H
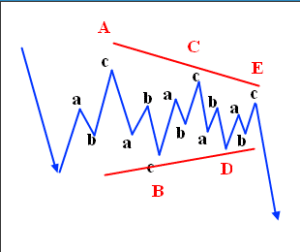
A Triangle is a common 5 wave pattern labeled A-B-C-D-E that moves counter-trend and is corrective in nature. Triangles move within two channel lines drawn from waves A to C, and from waves B to D. A Triangle is either contracting or expanding depending on whether the channel lines are converging or expanding. Triangles are overlapping five wave affairs that subdivide into 3-3-3-3-3.
A Basic Triangle Pattern: