Home Elliott Wave Analysis: Triangle Pattern on The USDCHF Indicates
USD/CHF Forecast

Elliott Wave Analysis: Triangle Pattern on The USDCHF Indicates

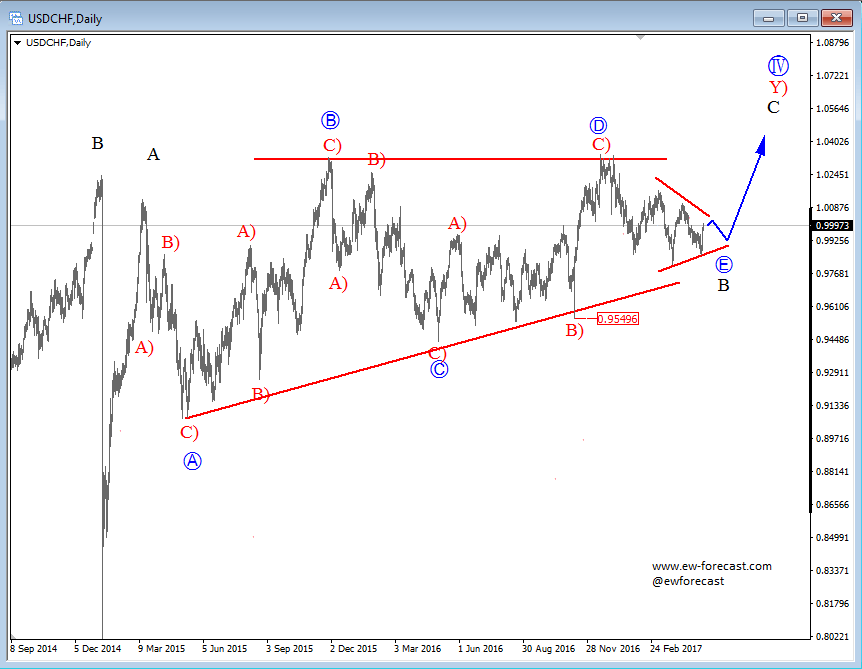
On the daily chart of USDCHF we see the price trading at the end of a higher degree wave B triangle, specifically in sub-wave E. We know that the triangle corrections are continuation patterns, which means that after they complete themselves they usually make a new run towards the direction of the trend. In our case this is to the upside within wave C. That said, we can see that sub-wave E is also overlapping, meaning it can also unfold as a triangle correction. After sub-wave E unfolds, we can expect a new five wave development to take place within the final wave C of Y).

USDCHF, Daily

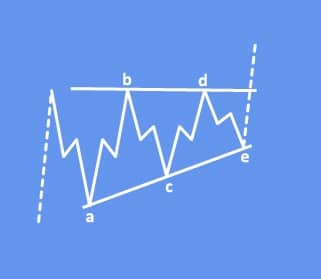
A Triangle is a common 5-wave pattern labeled A-B-C-D-E that moves counter-trend and is corrective in nature. Triangles move within two channel lines drawn from waves A to C, and from waves B to D. A Triangle is either contracting or expanding depending on whether the channel lines are converging or expanding. Triangles are overlapping five wave affairs that subdivide 3-3-3-3-3.  Triangles can occur in wave 4, wave B, wave X position or in some very rare cases also in wave Y of a combination

Triangle Pattern:

Gregor Horvat

Gregor Horvat

Grega Horvat Grega is based in Slovenia and has been involved in markets since 2003. He is the owner of Ew-Forecast, but before that he was working for Capital Forex Group and TheLFB.com. His feature articles have been published on FXstreet.com, Thestreet.com, Action forex, Forex TV, Istockanalyst, ForexFactory, Fxtraders.eu, Insidefutures.com, etc. He recently won the award on FXStreet.com for Best Forex Analysis in 2016. At Ew-forecast he helps clients and educates them about the Elliott wave principle and how to label and track unfolding patterns in real time. His approach to the markets is mainly technical. He uses a lot of different methods when analyzing the markets such as candlestick patterns, MA, technical indicators etc. His specialty, however, is Elliott Wave Theory which could be very helpful especially if you know how to use it in combination with other tools/indicators. EW-Forecast To be involved in the market effectively, you need the right guidance and resources, and our team can help you to achieve that. Our team is providing advanced informations about Elliott Wave theory in real time. The Elliott Wave Principle gives you a method for identifying the behavior of the markets and at what points the market is most likely to turn. We help new traders who are interested in Elliott Wave theory to understand it correctly. We are doing our best to explain our views as simple as possible with educational goal, because knowledge itself is power!