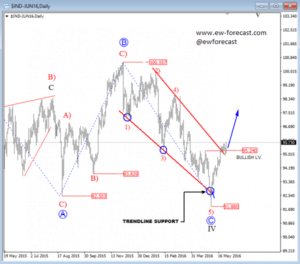
On USD index daily chart we are observing a big sideways pattern since the start of 2015; it’s a slow and overlapping price action which is a personality of a contra-trend movement that can be completed now. It was a flat correction in black wave IV; a three wave structure where the final wave C should be made by five waves. Well, we can see a nice decline from November 2015 counted in five legs, but as an ending diagonal. That’s a reversal pattern which may send the price into a strong bullish mode in the second part of this year, after the recent recovery above 95.22 and through the red trendline resistance. That said, be aware of more gains ahead.
USD Index, Daily
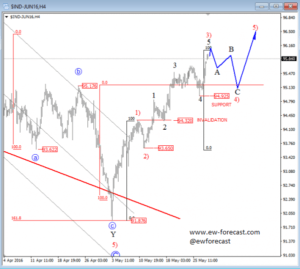
On the lower time frames, USD Index is on the sharp rise for the last few weeks, now in subwave five of 3) that is trading around 96.00 resistance at the moment where upside can be limited at the start of this week. We know that after every five waves the market will make an opposite move with three legs, so be aware of a corrective red wave four set-back once again to 95.00 area which would be a nice region for a new bounce.
USD Index, 4H