EUR/USD succumbed to the strength of the USD, following the upbeat ISM Non-Manufacturing PMI and other data. Where next? The path of least resistance is to the downside.
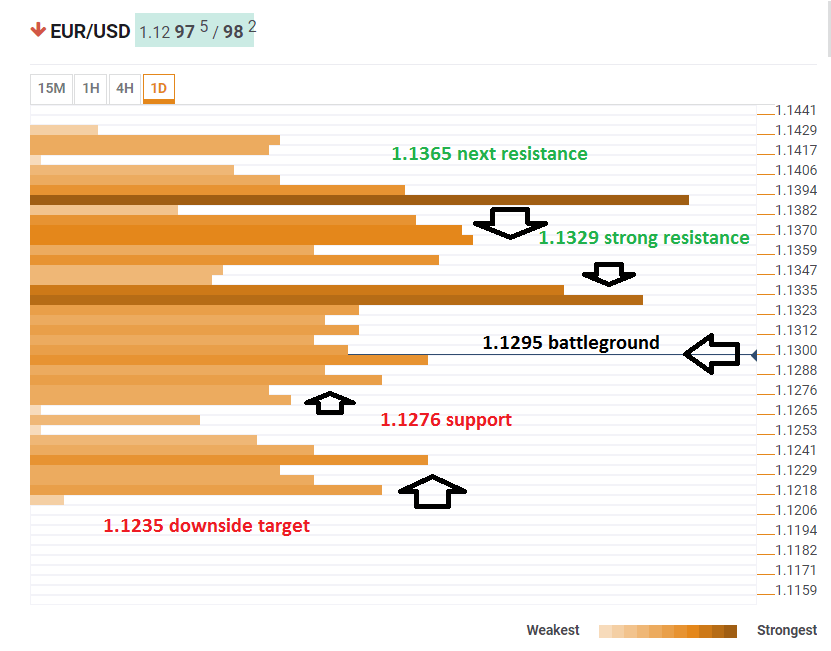
The Technical Confluences Indicator shows that the world’s most popular currency pair is struggling around 1.1295 where we see the convergence of the previous day’s low, the Bollinger Band 15 minutes Lower, the Fibonacci 23.6% one-month, the Simple Moving Average 10-15m, the SMA 5-15m, and the SMA 5-1h.
Fierce resistance awaits at 1.1329 where a dense cluster caps the pair. It consists of the Fibonacci 61.8% one-day, the SMA 50-1h, the previous weekly low, the Fibonacci 38.2% one-month, the BB 1d-Middle, and the BB 1h-Upper.
Further up, another significant resistance line awaits at 1.1365where the SMA 200-4h, the Fibonacci 61.8% one-week, and the PP one-day R2.
Weak support awaits at 1.1276 where the PP 1w-S2 meets the PP 1d-S1 and the Fibonacci 161.8% one-week.
The next noteworthy line is 1.1235 where we see last month’s low, the PP 1m-S3, and the PP 1w-S3.
Here is how it looks on the tool:
Confluence Detector
The Confluence Detector finds exciting opportunities using Technical Confluences. The TC is a tool to locate and point out those price levels where there is a congestion of indicators, moving averages, Fibonacci levels, Pivot Points, etc. Knowing where these congestion points are located is very useful for the trader, and can be used as a basis for different strategies.
This tool assigns a certain amount of “weight” to each indicator, and this “weight” can influence adjacents price levels. These weightings mean that one price level without any indicator or moving average but under the influence of two “strongly weighted” levels accumulate more resistance than their neighbors. In these cases, the tool signals resistance in apparently empty areas.
