EUR/USD is trading in a narrow range above 1.1200 as markets await the all-important US Non-Farm Payrolls. What’s next? The world’s most-popular currency pair has more room to the downside.
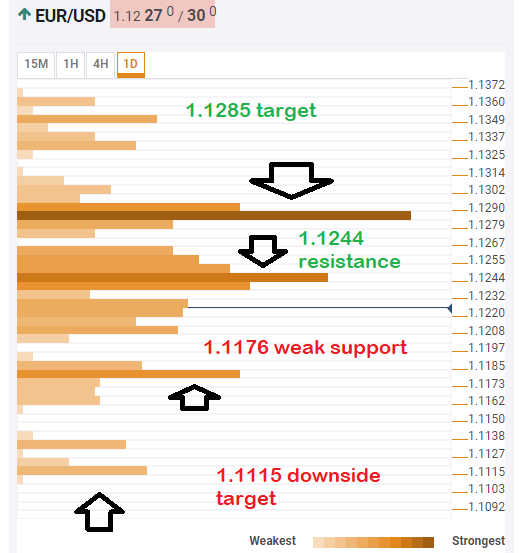
The Technical Confluences Indicator shows that resistance awaits EUR/UDS at 1.1244 which is the confluence of the Fibonacci 23.6%, the Simple Moving Average 200-1h, and the Fibonacci 23.6% one-month.
It then faces fierce resistance at 1.1285, which is the confluence of the Fibonacci 38.2% one-month, the Bollinger Band one-day Middle, the Fibonacci 61.8% one-week, the SMA 100-4h, and the Pivot Point one-day Resistance 3.
Looking down, some support awaits around the 2019 trough of 1.1176 where a cluster including the PP 1w-S1, the PP 1d-S2, the BB 4h-Lower, and others offer a cushion to the pair.
Further down, support lines are few and far between. The next considerable cushion at 1.1115 where the Pivot Point one-month awaits EUR/USD.
All in all, the path of least resistance is down.
Here is how it looks on the tool:
Confluence Detector
The Confluence Detector finds exciting opportunities using Technical Confluences. The TC is a tool to locate and point out those price levels where there is a congestion of indicators, moving averages, Fibonacci levels, Pivot Points, etc. Knowing where these congestion points are located is very useful for the trader, and can be used as a basis for different strategies.
This tool assigns a certain amount of “weight” to each indicator, and this “weight” can influence adjacents price levels. These weightings mean that one price level without any indicator or moving average but under the influence of two “strongly weighted” levels accumulate more resistance than their neighbors. In these cases, the tool signals resistance in apparently empty areas.
