EUR/USD is trading around 1.1300, at familiar levels, after retreating from around 1.1340 seen on Friday. Will it return to the upside or extend its falls? The downside looks more appealing.
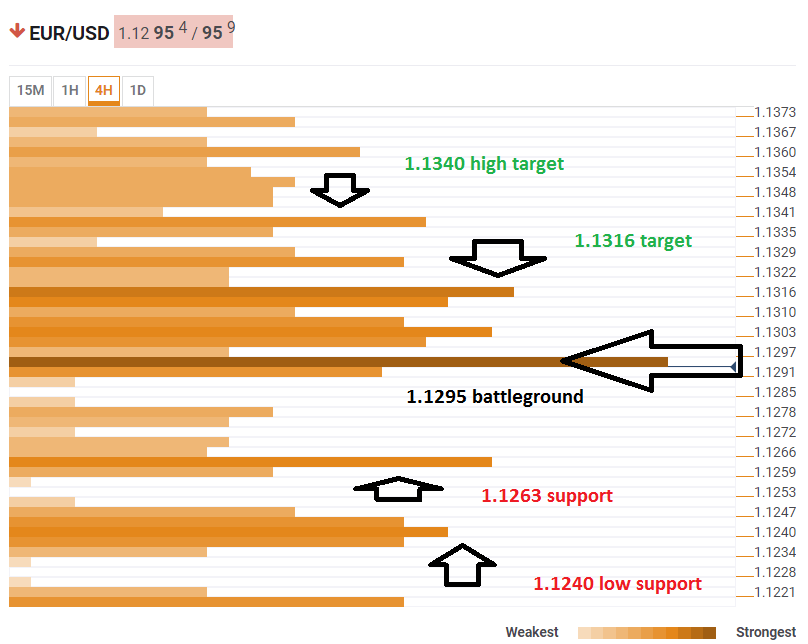
The Technical Confluences Indicator shows that euro/dollar is struggling with 1.1295 where we see a dense cluster including the Bollinger Band one-hour Lower, the BB 15-minutes Lower, the BB 4h-Middle, the previous day’s low, the Simple Moving Average 100-1h, the SMA 10-15m.
On the topside, the pair faces quite a few resistance levels culminating at 1.1316 where we see the previous 4h-high, the SMA 100-15m, the SMA 5-4h, the BB 1h-Middle, and additional lines.
If EUR/USD breaks free, the target would be 1.1338 where the previous day’s high, the PP one-day R1, and the BB 1h-Upper converge.
There are fewer lines to the downside, where a significant support area awaits only at 1.1263, which is the confluence of the Fibonacci 23.6% one-week and the Fibonacci 161.8% one-day,
Further down, 1.1240 is the next target, where the convergence of the BB 1d-Lower, the previous week’s low, and the PP one-month Support 1 await.
Here is how it looks on the tool:
Confluence Detector
The Confluence Detector finds exciting opportunities using Technical Confluences. The TC is a tool to locate and point out those price levels where there is a congestion of indicators, moving averages, Fibonacci levels, Pivot Points, etc. Knowing where these congestion points are located is very useful for the trader, and can be used as a basis for different strategies.
This tool assigns a certain amount of “weight” to each indicator, and this “weight” can influence adjacents price levels. These weightings mean that one price level without any indicator or moving average but under the influence of two “strongly weighted” levels accumulate more resistance than their neighbors. In these cases, the tool signals resistance in apparently empty areas.
