EUR/USD kicks off the new trading week around the same levels it ended the previous one, seeking a new direction as the trade dispute between the US and China continues. What’s next?
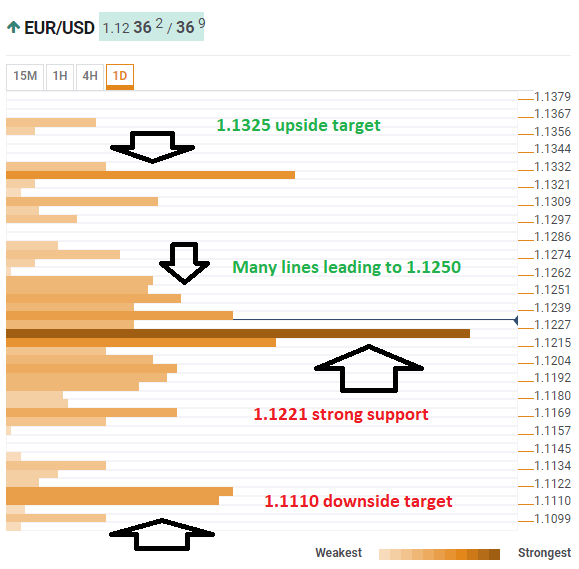
The Technical Confluences Indicator shows that the world’s most popular currency pair enjoys massive support around 1.1221 which is the convergence of the previous year’s low, the Fibonacci 38.2% one-week, the Simple Moving Average 100-1h, the Bollinger Band one-day Middle, and the BB 4h-Middle.
Should it break lower, there are several cushions on the way down but EUR/USD may easily target 1.1110, the 2019 trough and also the Pivot Point one-month Support 1 and the Fibonacci 161.8% one-week.
Looking up, euro/dollar may struggle on its way to 1.1250. These include the Fibonacci 23.6% one-day, the Fibonacci 61.8% one-month, the BB 4h-Upper, the BB 1h-Middle and more.
If it moves higher, it will target the 1.1325 cluster which is the confluence of the SMA 100-1d, the PP 1m-R1, and the previous monthly high.
Here is how it looks on the tool:
Confluence Detector
The Confluence Detector finds exciting opportunities using Technical Confluences. The TC is a tool to locate and point out those price levels where there is a congestion of indicators, moving averages, Fibonacci levels, Pivot Points, etc. Knowing where these congestion points are located is very useful for the trader, and can be used as a basis for different strategies.
This tool assigns a certain amount of “weight” to each indicator, and this “weight” can influence adjacents price levels. These weightings mean that one price level without any indicator or moving average but under the influence of two “strongly weighted” levels accumulate more resistance than their neighbors. In these cases, the tool signals resistance in apparently empty areas.
