EUR/USD is trading in the same old range as tension mounts towards the all-important ECB decision. Will Draghi drag down the Euro or will he prop it up?
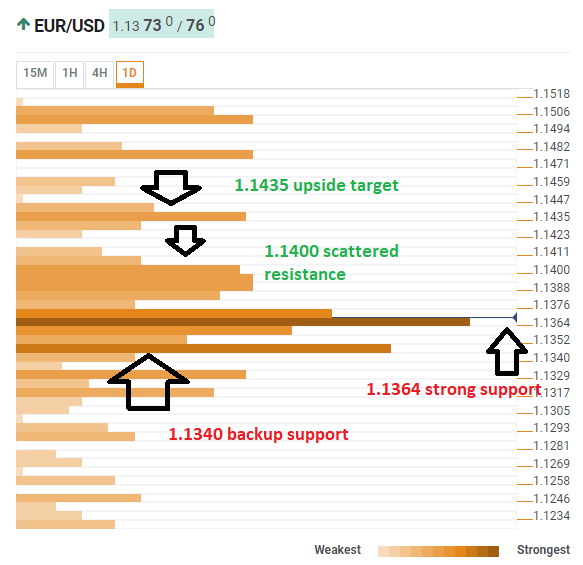
The Technical Confluences Indicator shows that euro/dollar enjoys robust support at around 1.1364 where we see a dense cluster including the Simple Moving Average100-4h, the SMA 10-one-day, the Fibonacci 38.2% one-day, the SMA 200-1h, the SMA 5-4h, the SMA 50-4h, the Bollinger Band 15-minutes Lower, and the BB one-day Middle.
Further support is close by, at 1.1340 where we see the Fibonacci 61.8% one-day, the SMA 10-4h, and the Bollinger Band 1h-Lower all converge.
Looking up, the road to 1.1400 is dotted with quite a few levels of resistance including yesterday’s high, the Fibonacci 38.2% one-month, the Fibonacci 38.2% one-week, and the Fibonacci 23.6% one-week. However, these caps are scattered out and not as potent as the support levels.
In case the pair runs higher, 1.1435 is an initial target including the BB 4h-Upper, the Fibonacci 23.6% one-month, and last week’s high.
Here is how it looks on the tool:
Confluence Detector
The Confluence Detector finds exciting opportunities using Technical Confluences. The TC is a tool to locate and point out those price levels where there is a congestion of indicators, moving averages, Fibonacci levels, Pivot Points, etc. Knowing where these congestion points are located is very useful for the trader, and can be used as a basis for different strategies.
This tool assigns a certain amount of “weight” to each indicator, and this “weight” can influence adjacents price levels. These weightings mean that one price level without any indicator or moving average but under the influence of two “strongly weighted” levels accumulate more resistance than their neighbors. In these cases, the tool signals resistance in apparently empty areas.
