The EUR/USD ended its period of stability and began falling as the US Dollar gains ground across the board. What are the next levels to watch?
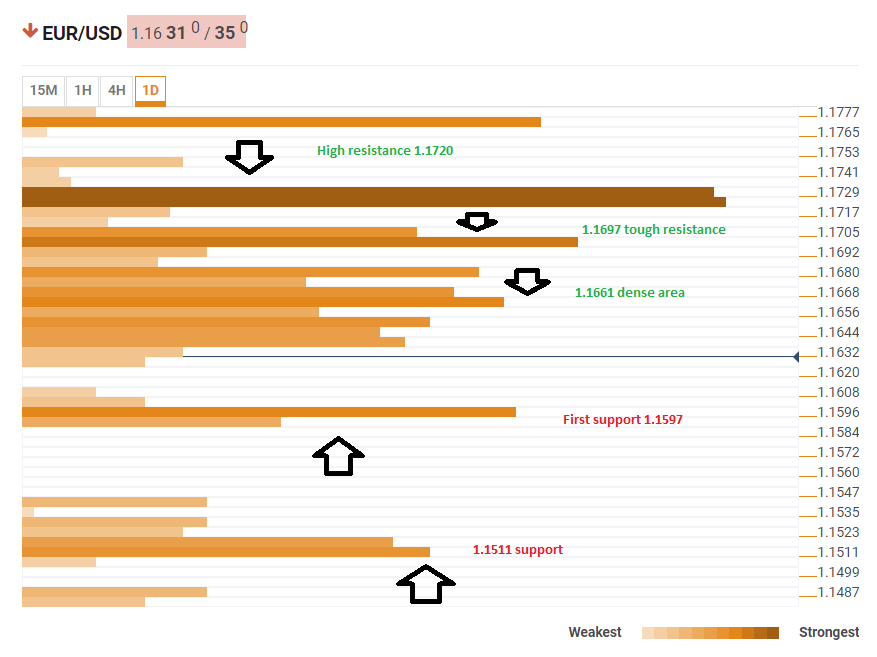
The Technical Confluences Indicator shows that the pair has some support at 1.1596 which is the convergence of the Fibonacci 23.6% one-month, the one-week low, and the Pivot Point one-day Support 3.
If the EUR/USD loses this level, the door is open to a free-fall to the 1.1511 area. This is the confluence of the Pivot Point one-month Support 1, the one-month low, and the 2018 low.
Looking up, recovering may be quite hard. 1.1661 is the congestion of the Fibonacci 61.8% one-week, the Simple Moving Average 5-1h, the Fibonacci 23.6% one-day, the Bolinger Band one-day Middle, the Bolinger Band 15m-Middle, the SMA 50-15m, the SMA 10-1h, the SMA 100-4h, the Fibonacci 38.2% one-day.
1.1697 is the confluence of the Pivot Point one-day Resistance 1, the one-day high, the SMA 200-1h, the SMA 50-4h, and the Fibonacci 38.2% one-week.
The ultimate resistance line is at 1.1720 area which is the congestion of potent lines of resistance: the SMA 5-one-day, the Pivot Point one-day Resistance 2, the Fibonacci 61.8% one-month, the SMA 50-one-day, the Fibonacci 161.8% one-day, and the Fibonacci 23.6% one-week.
Here is how it looks on the tool:
Confluence Detector
The Confluence Detector finds exciting opportunities using Technical Confluences. The TC is a tool to locate and point out those price levels where there is a congestion of indicators, moving averages, Fibonacci levels, Pivot Points, etc. Knowing where these congestion points are located is very useful for the trader, and can be used as a basis for different strategies.
This tool assigns a certain amount of “weight” to each indicator, and this “weight” can influence adjacents price levels. These weightings mean that one price level without any indicator or moving average but under the influence of two “strongly weighted” levels accumulate more resistance than their neighbors. In these cases, the tool signals resistance in apparently empty areas.
