EUR/USD has been on the back foot after the US reported more job gains than had been expected in June. Friday’s Non-Farm Payrolls sent the greenback significantly higher. Can euro/dollar recovery? It faces several hurdles.
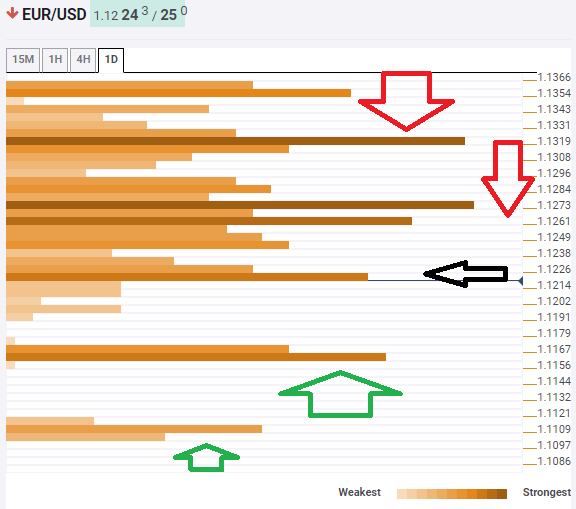
The Technical Confluences Indicator is struggling around 1.1220 which is the meeting point of the Pivot Point one-month Support 1, the previous hourly low, and the previous four-hour low.
Looking up, the world’s most popular currency pair faces fierce resistance at a region spanning from 1.1261 to 1.1273. This is a cluster consisting of the Simple Moving Average 50-1h, the Fibonacci 38.2% one-week, the Bollinger Band 4h-Lower, the SMA 200-4h, the SMA 100-1d, the Fibonacci 61.8% one-month, and the Fibonacci 61.8% one-day.
Even higher, another considerable cap awaits at 1.1319 which is the confluence of the Fibonacci 38.2% one-month and the Fibonacci 61.8% one-week.
Looking down, support awaits at 1.1161 where the previous monthly low, the PP 1d-S2, and the PP 1w-S1 converge.
Below, only weak support awaits at 1.1109 where the BB 1d-Lower, the PP 1d-S3, and the PP 1w-S2 await EUR/USD.
Here is how it looks on the tool:
Confluence Detector
The Confluence Detector finds exciting opportunities using Technical Confluences. The TC is a tool to locate and point out those price levels where there is a congestion of indicators, moving averages, Fibonacci levels, Pivot Points, etc. Knowing where these congestion points are located is very useful for the trader, and can be used as a basis for different strategies.
This tool assigns a certain amount of “weight” to each indicator, and this “weight” can influence adjacents price levels. These weightings mean that one price level without any indicator or moving average but under the influence of two “strongly weighted” levels accumulate more resistance than their neighbors. In these cases, the tool signals resistance in apparently empty areas.
