Home EURUSD Broke 2012 Support Line; Can This Be Start of
Forex News Today: Daily Trading News

EURUSD Broke 2012 Support Line; Can This Be Start of

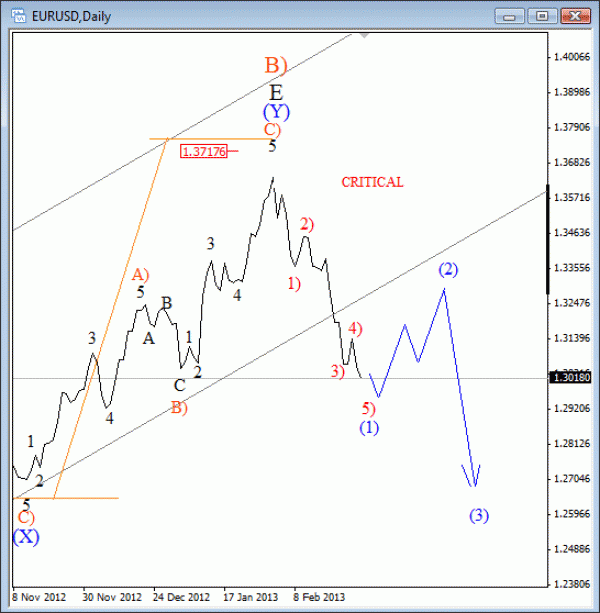
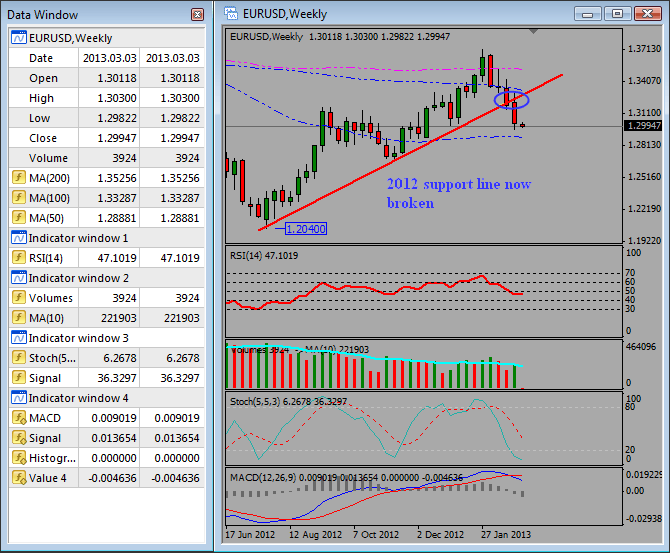
Recently we were tracking a possible corrective decline from 1.3700 on EURUSD because of the overlapping structure. However, a sharp and extended fall through the 2012 support line with a weekly and monthly close price beneath it forced us to rework the count.

In fact, we decided to check the line chart, where a fall is pretty clean and directional. A move can be counted impulsively and that is a bearish sign for the pair, but we expect a three wave bounce back to 1.3300 in March, before downtrend extends.

EURUSD daily- line chart

EURUSD Elliott Wave Analysis March 4 2013

EURUSD monthly

EURUSD Weekly  Elliott Wave Analysis March 4 2013

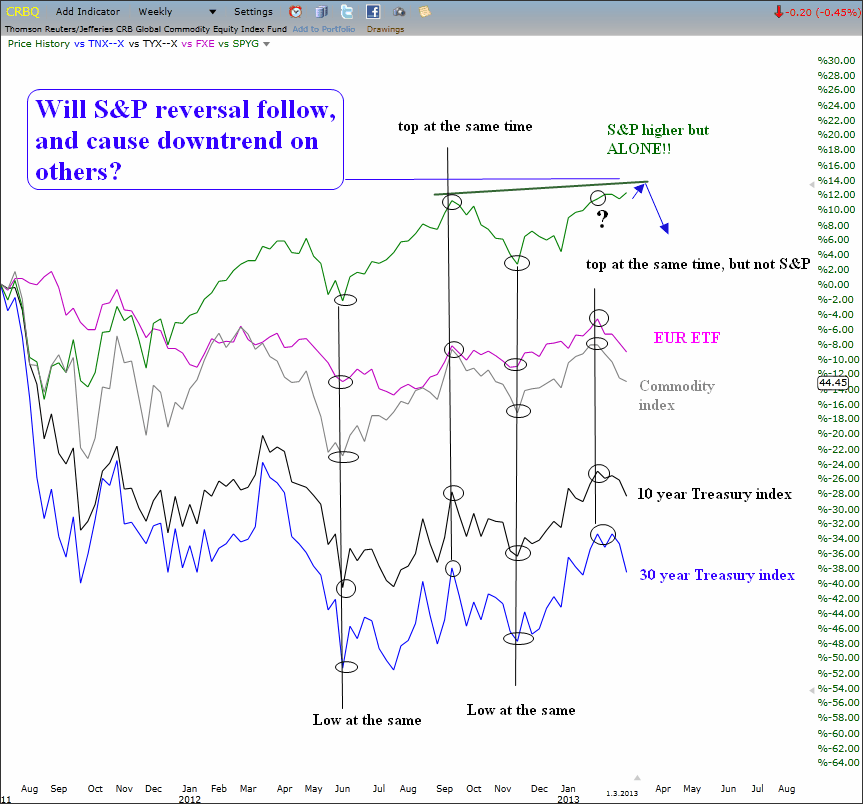
The reason why we also turned bearish on EURUSD is the overlay chart below which shows that most of other correlated markets turned lower, but not S&P which is still bullish, yet it remains alone. This could be a sign and S&P is approaching its top.

If this proves correct and if S&P will turn lower from 1560-1600, then the USD will probably accelerate sharply. The greenback is already showing strength without any help from S&P.

Market Correlations

S&P EUR USD Correlation Analysis Elliott Wave March 4 2013

Get more charts and forecasts with free access through  7-Day Trial Offer.

You can also follow us on twitter  @ewforecast

Gregor Horvat

Gregor Horvat

Grega Horvat Grega is based in Slovenia and has been involved in markets since 2003. He is the owner of Ew-Forecast, but before that he was working for Capital Forex Group and TheLFB.com. His feature articles have been published on FXstreet.com, Thestreet.com, Action forex, Forex TV, Istockanalyst, ForexFactory, Fxtraders.eu, Insidefutures.com, etc. He recently won the award on FXStreet.com for Best Forex Analysis in 2016. At Ew-forecast he helps clients and educates them about the Elliott wave principle and how to label and track unfolding patterns in real time. His approach to the markets is mainly technical. He uses a lot of different methods when analyzing the markets such as candlestick patterns, MA, technical indicators etc. His specialty, however, is Elliott Wave Theory which could be very helpful especially if you know how to use it in combination with other tools/indicators. EW-Forecast To be involved in the market effectively, you need the right guidance and resources, and our team can help you to achieve that. Our team is providing advanced informations about Elliott Wave theory in real time. The Elliott Wave Principle gives you a method for identifying the behavior of the markets and at what points the market is most likely to turn. We help new traders who are interested in Elliott Wave theory to understand it correctly. We are doing our best to explain our views as simple as possible with educational goal, because knowledge itself is power!