EUR/USD finally burst out of range and rallied very nicely. Is there more in store? GDP figures stand out this week. Here is an outlook for the highlights of this week and an updated technical analysis for EUR/USD.
While PMIs failed to impress, the employment situation in the euro-zone is improving, with better data from Germany and Spain. However, the big rally can be attributed to the greenback’s crash that was mostly fueled by a worrying report for the services sector. Draghi could not halt the rally.
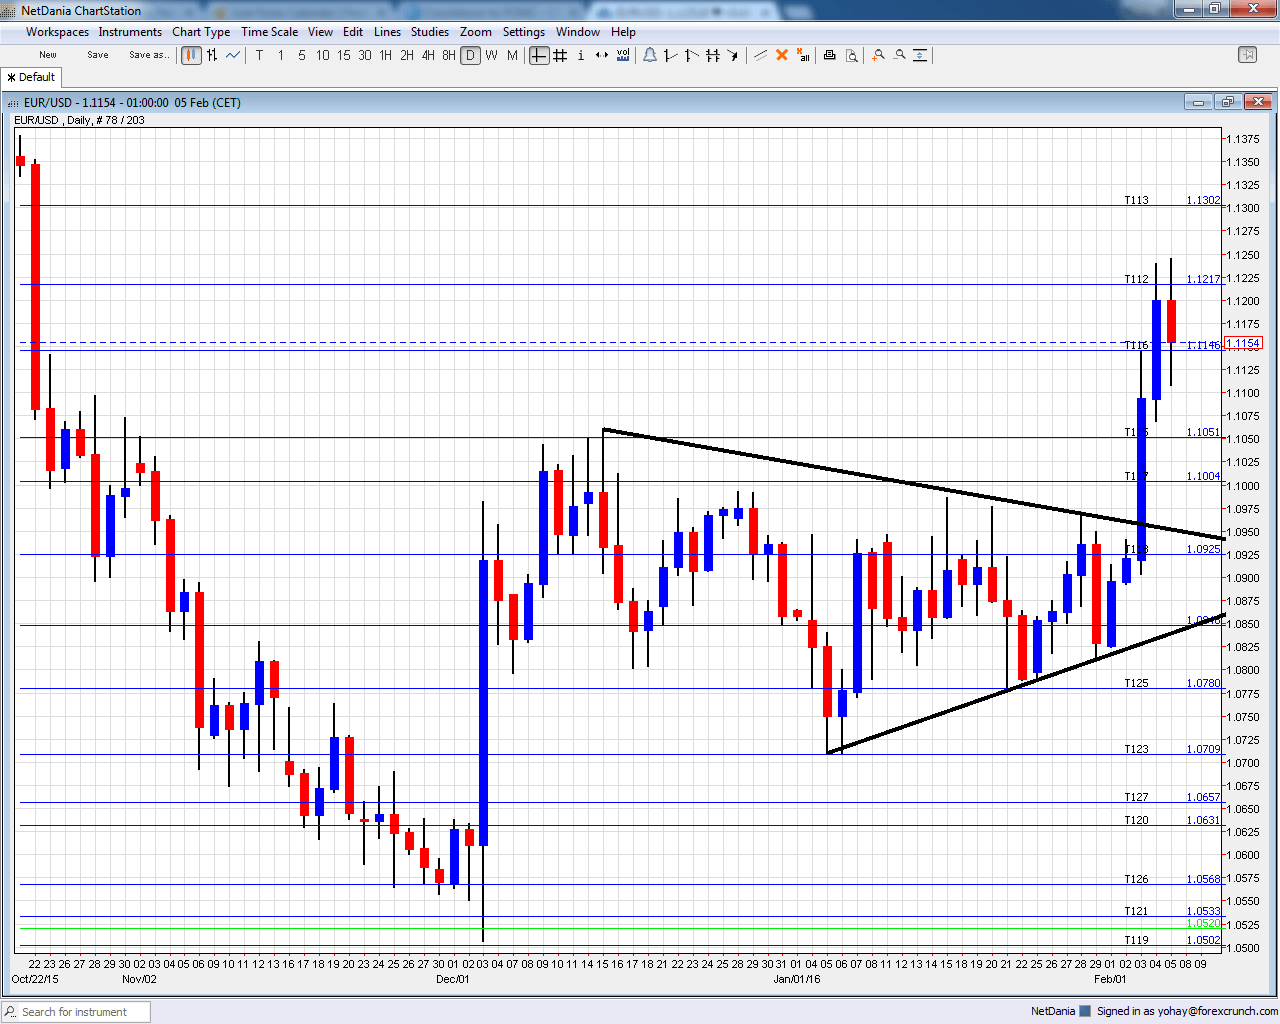
[do action=”autoupdate” tag=”EURUSDUpdate”/]EUR/USD daily graph with support and resistance lines on it. Click to enlarge:
- German Industrial Production: Monday, 7:00. The locomotive of the euro-zone suffered a slide of 0.3% in industrial output during November. A rise of 0.2% is expected now.
- Sentix Investor Confidence: Monday, 9:30. This business confidence indicator dropped more than expected in January to 9.6 points, reflecting worries about the global economy. A drop to 7.2 points is on the cards.
- German Trade Balance: Tuesday, 7:00. Germany’s wide trade surplus is one of the things that keeps the euro bid. After standing at 19.7 billion euros in December, a similar figure is likely: 19.4 billion.
- French Industrial Production: Wednesday, 7:45. Also the second largest economy saw a drop in output, 0.9% in November. It could bounce now by 0.2% according to expectations.
- Eurogroup meetings: Thursday. The Greek negotiations have been going on in the background and the first review of the third bailout is coming to a conclusion. This is the time to discuss Greece’s debt relief. Will we see the ministers discuss this sensitive topic? If so, Greece could move from the back-burner to the fore-front. However, they could kick the can down the road once again, as seen in previous events.
- German GDP: Friday, 7:00. This is the preliminary release for Q4 2015. The No. 1 economy advanced 0.3% in Q3 2015, less than expected, and certainly did not lead. The publication is the key for the all euro-zone figure. Growth is expected to be identical: 0.3% q/q once again. Note that Germany published the final CPI (-0.8% exp.) and the WPI (+0.2% exp.) at the same time, but the GDP publication is far more important.
- French NFP: Friday, 7:45. France saw no change in employment during Q3 according to the final figure. We could have a rise of 0.1% in the preliminary publication for Q4.
- Italian GDP: Friday, 9:00. The third largest economy has been stagnant for long periods of time but did enjoy some growth in 2015. In Q3, it rose 0.2%. This is the last release shaping the all European figure. An accelerated pace of 0.3% is predicted.
- GDP: Friday, 10:00. While this Flash figure is released after the German, French, Italian and Spanish publications, it still grabs headlines. In Q3 it was 0.3%, identical to Germany’s growth. A repeat at 0.3% is what economists are seeing.
- Industrial output: Friday, 10:00. Also here, the publication follows the individual states but is still noteworthy. A drop of 0.7% was recorded in November and a bounce of 0.7% is now predicted.
* All times are GMT
EUR/USD Technical Analysis
Euro/dollar started the week within the narrowing triangle (mentioned last week), but eventually made a clear break to the upside..
Technical lines from top to bottom:
We start from higher ground this time: 1.1460 was a key resistance line in 2015 and 1000 above the multi-year lows. 1.1373 is a veteran line from 2003 that continued playing a role also in 2015.
1.13 worked as support back in October and is the high line at the moment. It is followed by the swing low of 1.1220 in September which is minor resistance now.
1.1140 cushioned the pair in October. 1.1050 is the high seen in December and the next challenge on the upside.
1.10 is a round number and significant resistance. 1.0925, which was a support line in December, is the next support line. 1.0850 was the level the pair bounce off at the dying moments of 2015.
The post-Draghi low 1.0780 replaces 1.08 as support. 1.0710 is the next support line on the chart after temporarily capping the pair in April 2015. 1.0630 worked as nice support in November 2015 and then switched to resistance.
It is the last line before plunging to 1.0530, that supported the pair in April. Below, the 12 year low of 1.0460 seen in March.
Broken Wedge
As the black lines show, EUR/USD traded in a narrowing range, which was clearly broken.
I am neutral on EUR/USD
The weakness in the greenback was exacerbated by stops and we could see some consolidation before a new direction is established.
Our latest podcast is titled Americans get a raise, negativity in Japan, Gas Naturally Low
