EURUSD Daily Analysis
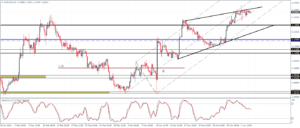
EURUSD (1.13): EURUSD has closed for two consecutive days with a spinning top candlestick pattern which could indicate a near-term decline in prices. 1.130 which was a previously broken resistance level could be seen now being tested for support. Below 1.130, a decline further could see EURUSD fall towards the next support level near 1.120. On the 4-hour chart, price action has been consolidating into a rising wedge pattern which could see prices breakout to the downside for a test to 1.130.
USDJPY Daily Analysis
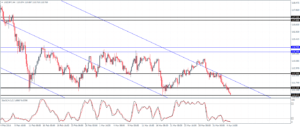
USDJPY (110.8): USDJPY has broken the 111.0 support and is now seen trading near the 110.7 handle. Price action is now close to trading at 110.672, which was the low formed on 17th March. Failure to hold above this low could see USDJPY post further declines towards the 110 handle. To the upside, price action looks weak with support/resistance at 111.31 likely to hold any gains. We anticipate that USDJPY could remain weak to the downside, but the momentum is likely to ease.
GBPUSD Daily Analysis
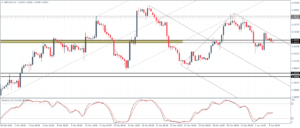
GBPUSD (1.42): GBPUSD managed to close on a bullish note following the previous three days of bearish price action. Multiple tests to 1.42 confirm the support level here, and only a break below 1.42 will see further downside in GBPUSD. On the 4-hour chart, price action is seen trading near the support at 1.426 – 1.424. A break below this level could see further downside in store ahead of a test to 1.42. A break below 1.42 will confirm a move to the downside towards 1.41 and eventually to 1.4025 – 1.40 support level that is yet to be tested.
Gold Daily Analysis
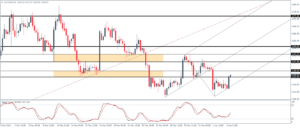
XAUUSD (1226): Gold prices are looking to move up again following yesterday’s bearish close. So far price action has formed a bullish engulfing pattern, but a daily close will confirm this bias. The new rising median line on the chart shows Gold back at one of the support/resistance levels, currently in the 1230 – 1225 zone. A break higher will see further upside to the 1243 – 1237 zone. Overall, Gold prices are likely to stay limited below 1250 and 1215 levels.
