EURUSD Daily Analysis
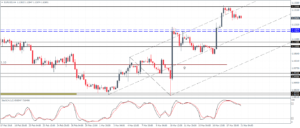
EURUSD (1.12): Continuing from Friday’s price action, EURUSD is back trading near the 11th February highs of 1.1323 – 1.130 level of resistance. A break above 1.13 is essential for EURUSD to post new highs, failing which, below the resistance zone low of 1.120, a dip back to 1.11 is possible. On the 4-hour chart, price action in EURUSD is currently seeing a consolidation following the rally over the past few days. As such, 1.13350 resistance on the 4-hour chart will be critical for further price action with 1.1202 – 1.119 coming in as the lower support. A break below this support could see EURUSD test the next support at 1.113 – 1.1105. As long as EURUSD is supported above 1.11, the bias remains to the upside.
USDJPY Daily Analysis
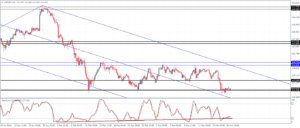
USDJPY (111.5): USDJPY broke below 112.0 support level but managed to close Friday’s session with a modest bullish price action. A close back above 112.0 could see further upside in store, but price action’s rally could be limited to the 114.35 – 114.70 resistance. The 4-hour chart shows a strong bearish divergence forming on prices above the 111.31 support. A close above 112.0 – 112.50 will confirm the move towards 117.0 – 117.25 if the interim resistance level of 114.35 – 114.70 gives way. To the downside, below 111.31, a test to 110 is evident.
GBPUSD Daily Analysis
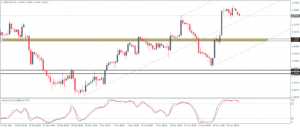
GBPUSD (1.44): GBPUSD formed a doji candlestick pattern on Friday and if today’s bearish price action closes below the low of 1.441, a short-term correction is on the cards. On the 4-hour chart, price action is already showing bearish signs with the occurrence of doji candlestick patterns above 1.448 with a minor support formed at 1.443. A break below this level could see GBPUSD slip towards 1.4263 – 1.4247 support. The bias remains to the upside, as long as GBPUSD remains above the aforementioned support, failing which, a dip to 1.4025 – 1.40 support is possible.
Gold Daily Analysis
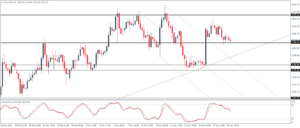
XAUUSD (1251): Gold prices are likely to close on the third day of bearish declines, following the small bodied candlestick patterns formed above the 1250 level which has retested the breakout from the daily chart’s rising wedge pattern. However, 1250 still remains a key support with Gold biased to the upside. A break below 1250 could see Gold prices decline towards 1230 – 1225 support.
