EURUSD Daily Analysis
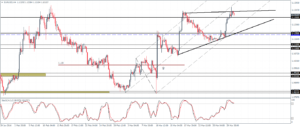
EURUSD (1.13): EURUSD closed on a bullish note yesterday at 1.13378 recovering the losses from the previous week and settling above 1.130 level of resistance. Price action is seen to be currently pulling back, and a close below 1.13 could keep the currency range bound within 1.120. On the 4-hour chart, we notice price action potentially reversing near the median line and this could be confirmed on a close below 1.13, which will likely see further declines lower towards 1.120 where support could now be established. There is also a large triangle pattern that is forming which could see a potential move towards 1.1105 – 1.113 lower support if 1.12 gives way.
USDJPY Daily Analysis
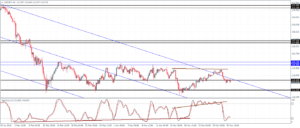
USDJPY (112.26): USDJPY barely managed to test the 112.0 support yesterday, and we expect another dip back to confirm this support ahead of any further gains. If 112.0 support fails, USDJPY could potentially move lower towards 111.0 levels while to the upside, rallies will likely be stalled near the 50 period EMA, which currently sits near the horizontal confluence of 114 – 114.5 levels. On the 4-hour chart, USDJPY is below the 112.5 support which could open the way for a dip to 111.31 if 112.0 fails to hold prices.
GBPUSD Daily Analysis
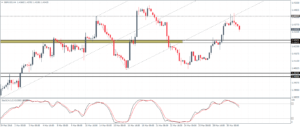
GBPUSD (1.43): GBPUSD formed a doji candlestick pattern again yesterday near the 1.443 resistance. A bearish close today below yesterday’s low of 1.436 could confirm another leg to the downside with a test back to 1.42 likely. On the 4-hour chart, short term support at 1.426 – 1.424 could offer a short term bounce, but a break below this level could see GBPUSD decline back lower to test the previous support at 1.4025 – 1.40 region.
Gold Daily Analysis
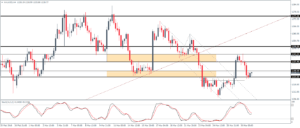
XAUUSD (1228): Gold prices reversed the previous day’s gains with prices closing near 1223 following a test to 1240 – 1250 levels of resistance. Further downside is likely if price action moves closer and breaks the previous day’s low. However, Gold is currently in the support level identified at 1230 – 1225, which could offer a short-term support. Only a break below this level will see further downside towards $1200.
