EURUSD Daily Analysis
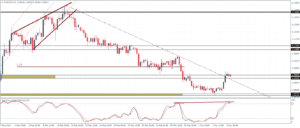
EURUSD (1.09): EURUSD reversed off the doji pattern over the last two days closing above the resistance at 1.095 – 1.093. Failure to test the lower support at 1.0835 – 1.0825 with closing prices exposes the risk of a decline back to this level. In the event EURUSD manages to continue to push higher the next resistance at 1.113 – 1.1105 will be targeted. A dip to the current resistance to establish support will pave the way for the next leg up. The falling trend line has been broken but in the interim, 1.10 level will be critical for further upside or downside in prices. The 4-hour Stochastics is showing a hidden bearish divergence, with the current lower high being seen with the oscillator’s higher high, which indicates a move lower. As such, EURUSD could dip back to 1.0835 – 1.0825 support if 1.10 resistance holds.
USDJPY Daily Analysis
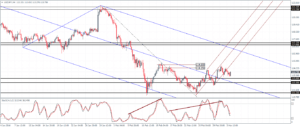
USDJPY (113.7): USDJPY remains flat on the daily chart following the test of support at 112. The daily chart shows the Stochastics printing a higher high against price’s lower high which could see a dip back to 112 if USDJPY fails to clear above 115. On the 4-hour chart, prices have broken out from the rising median line but so far prices are flat pending a test to 113 support. Below 113 – 112.5 support, lower support at 111.31 comes into question. To the upside, 115 resistance will need to be cleared for a move higher.
GBPUSD Daily Analysis
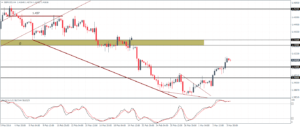
GBPUSD (1.41): GBPUSD has completed nearly four days of correction but prices are currently capped near 1.42 resistance. A bearish close below this level on the daily chart could see the downside momentum resume. On the 4-hour chart, however, support at 1.41 will be key. If the support holds, GBPUSD could push higher to 1.43 – 1.435 resistance level. A break below 1.41 could see GBPUSD move sideways within 1.40 lower support with a break below 1.40 opening the declines for a test back to previous lows.
Gold Daily Analysis
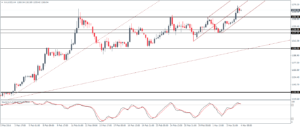
XAUUSD (1261): Gold prices finally managed to break above 1245 high and has posted a new high yesterday at 1264. The daily chart shows a strong bearish divergence currently with the Stochastics printing a lower high. A bearish close near these highs could see a correction down to 1108. On the 4-hour chart, Stochastics remains flat while prices broke above 1250. Establishing support at 1250 could validate further upside in Gold, but failure to hold prices could spell further declines in store.
