EURUSD Daily Pivots
| R3 | 1.1494 |
| R2 | 1.1451 |
| R1 | 1.1396 |
| Pivot | 1.1353 |
| S1 | 1.1297 |
| S2 | 1.1254 |
| S3 | 1.1198 |
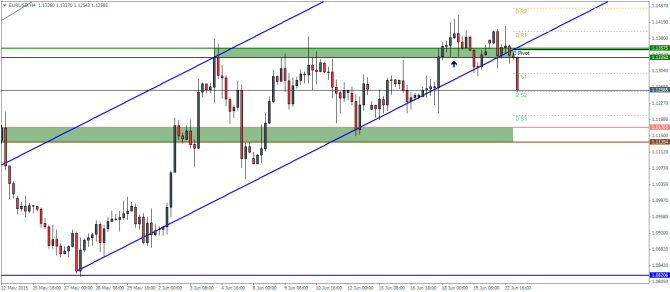
EURUSD (1.126): EURUSD has turned bearish on the daily charts after Thursday’s shooting star type of candlestick pattern. Failure to break above the shooting star’s high, and the bearish declines since, offer confirmation of a potential move to the downside.
On the intraday charts, price action stalled near the support/resistance level of 1.13575 – 1.1335 and we notice the most recent price action breaking out of the rising price channel. We expect a possible retracement to the break out level at 1.1335 which could then set the stage for a decline to 1.117. Alternatively, a continued decline to 1.117 without any retracement is indicative that the support zone could hold the prices near 1.117 through 1.1135. A break below the support could however see EURUSD decline to test the next support at 1.08.
USDJPY Daily Pivots
| R3 | 124.521 |
| R2 | 123.972 |
| R1 | 123.668 |
| Pivot | 123.109 |
| S1 | 122.805 |
| S2 | 122.256 |
| S3 | 121.952 |
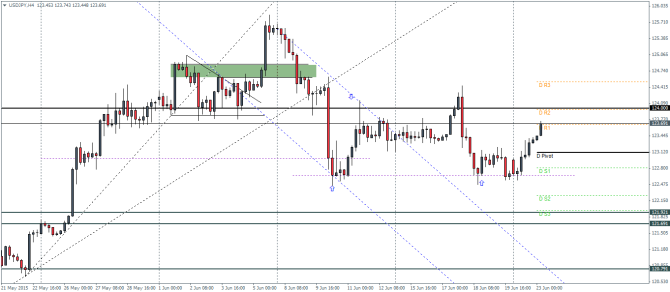
USDJPY (123.69): USDJPY looks to have formed a near double bottom on the daily charts at 122.466. This was further followed up by a bullish close yesterday. The intraday charts show 124 as the level of resistance which USDJPY will have to struggle to break above which could then bring the bullish bias back into the currency. Failure to close above 124 could however set the stage for a decline back to the double bottom at 122.466 and eventually down to 121.921 – 121.691 level of support.
GBPUSD Daily Pivots
| R3 | 1.5991 |
| R2 | 1.5949 |
| R1 | 1.5886 |
| Pivot | 1.5845 |
| S1 | 1.5782 |
| S2 | 1.5741 |
| S3 | 1.5678 |
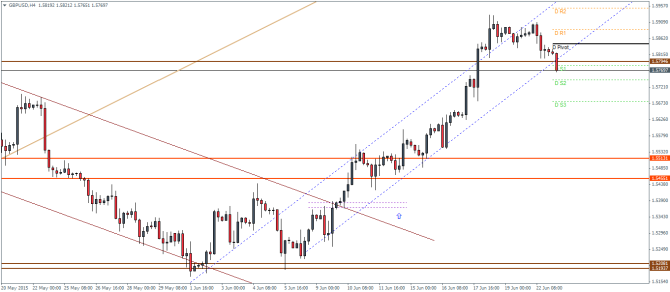
GBPUSD (1.577): GBPUSD turned bearish on Monday followed up by Friday’s doji candlestick pattern near 1.59. This is indicative that GBPUSD could test the next support at 1.57525, which was previously a resistance level. A successful test of support could see GBPUSD post fresh highs. On the other hand, failure to support prices near 1.57525 could shift the sentiment to bearish with the next support at 1.552 likely to be tested.
The intraday charts show price breaking out of the price channel near the short term support/resistance of 1.5795. A quick retest here could then see a decline to 1.551. On the other hand, watch for a potential move back to the upside above 1.5795 which could turn the Cable back into bullish territory.
In our latest podcast we digest the dollar dove dive, update on Greece and preview next week’s events.
