EURUSD Daily Pivots
| R3 | 1.1551 |
| R2 | 1.1417 |
| R1 | 1.1345 |
| Pivot | 1.1210 |
| S1 | 1.1138 |
| S2 | 1.1004 |
| S3 | 1.0932 |
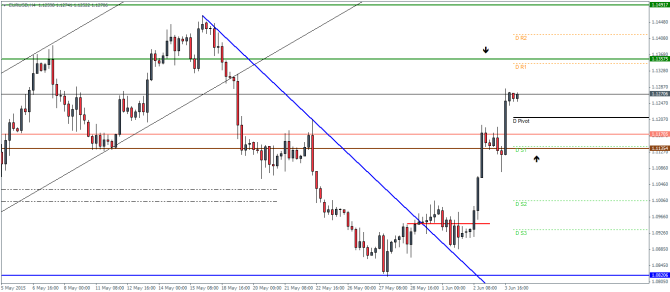
EURUSD (1.126): On the daily chart, EURUSD saw a bullish continuation yesterday with price now trading close to 1.12845 level of resistance. A close above 1.12845 is needed for price to target 1.148, the next level of resistance. On the intraday charts, price action has managed to close above 1.117 with the next resistance at 1.13575. We could possibly expect to see a dip towards the broken resistance at 1.117 in the near term before price can rally higher. A close above 1.13575 is needed to aim for further upside gains to 1.148 – 1.149. A close below the recently broken resistance at 1.117 – 1.1135 will however indicated a failed attempt in the rally and could see EURUSD decline lower back to 1.10.
USDJPY Daily Pivots
| R3 | 125.581 |
| R2 | 125.131 |
| R1 | 124.681 |
| Pivot | 124.231 |
| S1 | 123.798 |
| S2 | 123.331 |
| S3 | 122.898 |
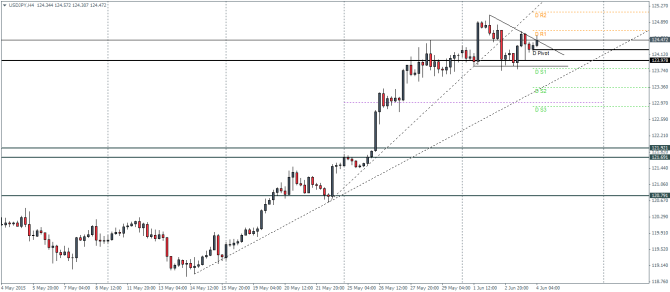
USDJPY (124.485): USDJPY dipped lower yesterday but managed to close on a bullish note. Price is trading below 124.775, just a few points below the 125.4 target level on the daily charts. On the intraday charts, we notice price congestion above 123.978 level of support. We could expect a dip to this level once again before price can rally towards 125.4 level. Price action is also shaping into a triangle pattern which on break out could indicate a bullish move higher. If prices fall below 123.978 we could anticipate a stronger correction to the downside towards 122.97 – 123 levels.
GBPUSD Daily Pivots
| R3 | 1.5516 |
| R2 | 1.5445 |
| R1 | 1.5391 |
| Pivot | 1.5321 |
| S1 | 1.5268 |
| S2 | 1.5198 |
| S3 | 1.5145 |
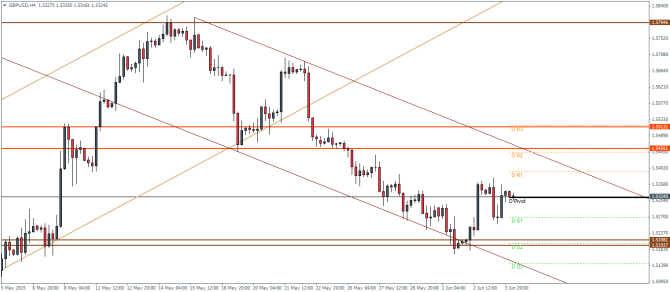
GBPUSD (1.5325): GBPUSD formed a doji candlestick yesterday after turning bullish a day before. In this aspect, a bullish close today is required to ascertain further gains. On the intraday charts, price managed to rally towards 1.532 after finding support near 1.52. A test to the previously broken support zone at 1.551 – 1.5455 looks increasingly possible in the near term. If the broken support turns to resistance, GBPUSD could start a fresh leg of declines targeting 1.52 and lower, while, if the resistance fails to act, price could target 1.58.
