EURUSD Daily Pivots
| R3 | 1.1516 |
| R2 | 1.1279 |
| R1 | 1.1052 |
| Pivot | 1.0816 |
| S1 | 1.0589 |
| S2 | 1.0352 |
| S3 | 1.0125 |
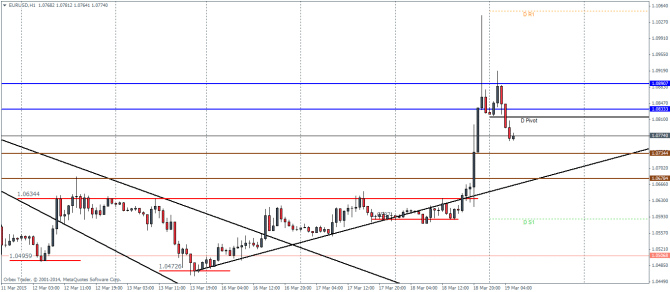
EURUSD broke out from the ascending triangle pattern and promptly rallied to both the objectives mentioned at 1.0678 and 1.0734 levels to make a spike to 1.1027 levels. Price action today is showing signs of easing with the currency trading at 1.07735 at the time of writing. The declines could likely be supported near any of the two levels from the ascending triangle. However a retest back to the broken support of the ascending triangle at 1.06344 could be likely possible as well. If the support holds, EURUSD could see another attempt to rally potentially breaking the previous resistance levels at 1.089 through 1.0833 levels. A break of the trend line below the ascending triangle pattern’s support/resistance level will shift the bias back to the downside.
More: EUR/USD: 2 Channels For Outflows & 2 Factors To Define A Bottom
USDJPY Daily Pivots
| R3 | 123.422 |
| R2 | 122.419 |
| R1 | 121.315 |
| Pivot | 120.312 |
| S1 | 119.207 |
| S2 | 118.205 |
| S3 | 17.129 |
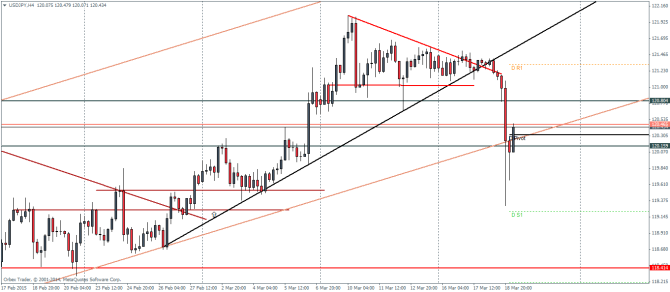
USDJPY failed the minor triangle break out and instead declined to the lows of 120.16 levels. Price action is currently supported by the major price channel which puts the bias to the upside intact. THe major test will be the break out of the broken support at 120.8, which if it turns to resistance could spell further declines in USDJPY. A break out and a retest at 120.8 for support would confirm the bullish short term bias in the USDJPY while a break below 120.16 could see 118.415 being the next downside support.
More: USDJPY Reverses Sharply, But Can Trend Continue?
GBPUSD Daily Pivots
| R3 | 1.5742 |
| R2 | 1.5456 |
| R1 | 1.5207 |
| Pivot | 1.4921 |
| S1 | 1.4673 |
| S2 | 1.4386 |
| S3 | 1.4138 |
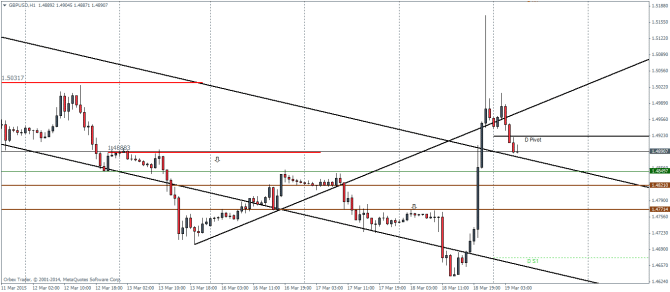
GBPUSD spiked to as high as 1.5155 before easing back to trade near 1.489 levels. Price action is however looking to show a sideways movement for a while as a break out in any direction is quite possible. To the upside, GBPUSD will have break above 1.50 levels for the currency to push higher, while, to the downside, price needs to head back into the falling price channel and preferably break below the two support levels at 1.482 and 1.477.
More: GBP/USD Breakout: Levels & Targets – BofA, Goldman
