EURUSD Daily Pivots
| R3 | 1.1484 |
| R2 | 1.1438 |
| R1 | 1.1386 |
| Pivot | 1.134 |
| S1 | 1.1287 |
| S2 | 1.1241 |
| S3 | 1.1188 |
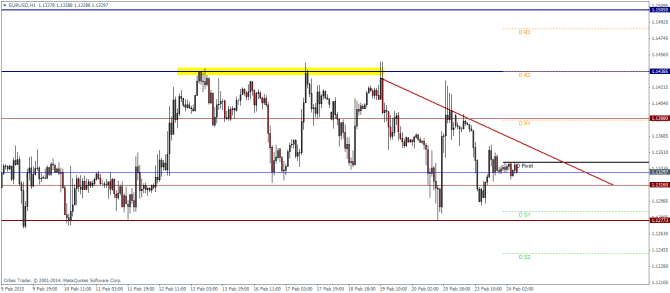
EURUSD continues to play range bound a pattern that has been in play since early February. The price levels of 1.143 and 1.127 have been established as strong support and resistance levels. Therefore a break out from either of these two levels could potentially set the path for future direction in EURUSD. In this aspect, the best option would be to wait for a break out and buy on a retest or a retracement. For a possible upside breakout, we do have the trend line plotted which could give an early indication. Alternatively, should price continue to trade below the trend line, we could get an early signal of a bearish momentum starting to build up.
USDJPY Daily Pivots
| R3 | 119.806 |
| R2 | 119.582 |
| R1 | 119.194 |
| Pivot | 118.97 |
| S1 | 118.582 |
| S2 | 118.351 |
| S3 | 117.970 |
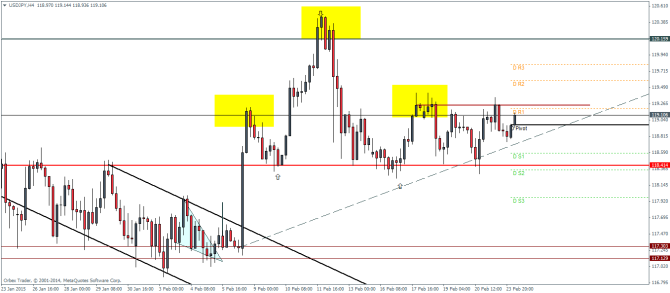
USDJPY has also been in a somewhat range pattern play for the past week. Although the H4 charts show a potential head and shoulders pattern, we will have to wait for a break of the neckline at 118.4 levels to ascertain this view. Alternatively a break above 119.25 levels, marked by the horizontal line could invalidate the view. The rising trend line pattern gives an indication that price action could indeed break out to the upside, invalidating the head and shoulders pattern that we are watching. Should this be true, we could see price target 120.16 levels to the upside.
GBPUSD Daily Pivots
| R3 | 1.5652 |
| R2 | 1.5562 |
| R1 | 1.5509 |
| Pivot | 1.5420 |
| S1 | 1.5366 |
| S2 | 1.5279 |
| S3 | 1.5225 |
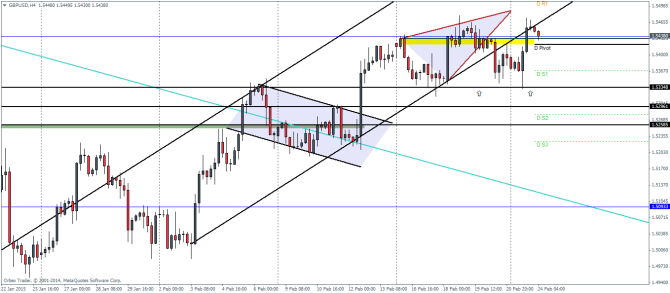
GBPUSD apparently broke down from the rising wedge/triangle pattern briefly hitting the downside target at 1.5335 before rallying back. However, we notice strong reversal patterns take place currently back near the lower end of the rising price channel. The failure to make a new high near this support/resistance level is indicative that we could see further downside, perhaps down to 1.53 levels before we can expect any upside gains. Alternatively should price form a base near the daily pivot level, we could see GBPUSD head back into the price channel and target the next upside resistance near 1.553 levels.
