EURUSD Daily Analysis
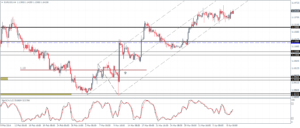
EURUSD (1.14): EURUSD closed last week with a doji pattern following the previous weeks of gains. This could signal a short-term pause, but a weekly close below the doji’s low at 1.1326 could signal a correction lower. Support comes in at 1.130 and 1.120. There is evidence that EURUSD could see a stronger correction lower towards 1.10 if the support levels near 1.12, 1.11 gives way. On the 4-hour chart, EURUSD has been consolidating near the lower median line and forming lower highs. A move below the short term base at 1.136 – 1.135 will confirm the move lower for 1.13 initially followed by 1.120.
USDJPY Daily Analysis
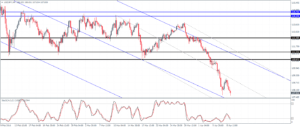
USDJPY (107.8): USDJPY remains biased to the downside with no strong evidence of any short term bounce or a correction. Price action is, however, trading near the support level of 108.1 – 108.0 region. A break below this level will see further declines towards 105.36 – 105 levels of support from which we can anticipate some kind of a correction to the upside. Any rallies ahead of USDJPY reaching the lower support at 105 levels will be capped near the resistance level of 112.4 – 111.4.
GBPUSD Daily Analysis
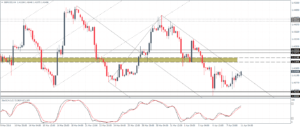
GBPUSD (1.41): Price action in GBPUSD is currently showing some conflicting signals. While there is a larger inverse head and shoulders pattern playing out with the right shoulder’s low formed near 1.405 – 1.41, a break below this level could see GBPUSD post new lows. Resistance at 1.4425 remains key for any further upside gains to be formed above 1.420. To the downside, 1.4025 – 1.40 will be key as a weekly close below this level could confirm a move lower.
Gold Daily Analysis
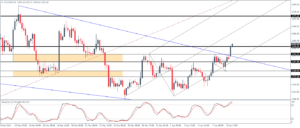
XAUUSD (1252): Gold prices closed with a doji candlestick pattern on Friday, but early Monday session has seen Gold prices start off on a bullish note. A higher close on the daily session could keep Gold biased to the upside. With prices trading near 1252 currently, the price action validated the bullish flag breakout which points to a minimum price target near the $1260 region. The downside is well supported with initial support at 1250 followed by 1243 – 1237 levels of support.
