EURUSD Daily Analysis
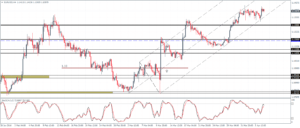
EURUSD (1.13): EURUSD continues to hover near the 1.13 – 1.14 levels, with the past four daily sessions closing in the range. The consolidation is likely to see price action open up in the near term for a breakout. On the 4-hour chart, following the bounce off the lower median line, EURUSD managed to move back higher, but failure to post new highs could see a sideways range ahead of a break to the downside. The Stochastics oscillator is printing a lower high against the higher high in price indicating a pullback. Support comes in at 1.13 followed by 1.12 with the longer-term pullback pointing to a dip towards 1.10 levels.
USDJPY Daily Analysis
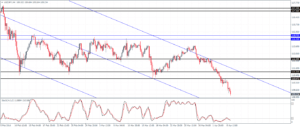
USDJPY (109.2): USDJPY continues its bearish trend with prices clearing the 110 level yesterday. The next downside target comes in at 107.51 which marks a 261.8% Fibonacci extension off the daily chart’s longer term head and shoulders pattern. However, currently, USDJPY is trading near a previously broken resistance level which could be tested for support offering a short-term bounce in prices if the support holds. Below 107.51, the next main support comes in at 105.375.
GBPUSD Daily Analysis
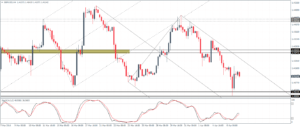
GBPUSD (1.41): GBPUSD saw a strong rejection yesterday near the lows of 1.40. Price action remains biased to the downside for now, but as long as prices are above 1.40 handle, the declines could be limited. In the event of a close below 1.40, GBPUSD could resume a new leg of declines towards 1.39 and potentially lining up to post new lows in prices. To the upside, prices are likely to be capped near resistance of 1.426 – 1.424 levels.
Gold Daily Analysis
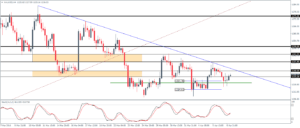
XAUUSD (1226): Gold prices have formed an inside bar on the daily chart yesterday and could see a potential breakout. To the upside, a daily close above the range high at 1236.8 could see a move towards 1250 while to the downside, a break below the range low at 1214.9 could see prices dip to 1200. Price action on the 4-hour chart is currently inconclusive, but the upside bias prevails if prices manage to break out higher and clear the 1230 – 1225 price zone and also manage to break the falling trend line.
