EURUSD Daily Analysis
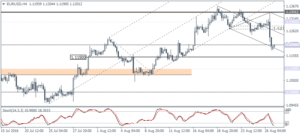
EURUSD (1.1201): EURUSD posted strong declines on Friday as prices touched down to 1.1200 as noted in our commentary earlier this week. Support at 1.1200 remains strong based on the confluence with the round number support and the rising median line on the daily chart. On the 4-hour time frame, price action is in sync with the bearish divergence that we noted after the Stochastics failed to confirm the higher high near 1.1341. Based on the expectation that 1.1200 will offer support, EURUSD could be seen retracing its losses, with minor resistance seen at 1.1270 – 1.1281. The pull back to this level should help the euro set up for further declines down to 1.1150. The bearish view changes hands on a convincing daily close above 1.1281 supported by a bullish candlestick pattern. Note that the weekly session has closed in an inside bar with a range of 1.1366 and 1.1153, making prices vulnerable to a breakout in either direction.
USDJPY Daily Analysis
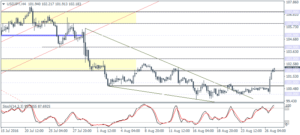
USDJPY (102.18): USDJPY closed at 101.78 on Friday, finally breaking out from the range high of 101.29 set on August 16. Resistance at 102.00 is likely to keep prices capped in the near term although USDJPY is seen currently trading near this level. Further upside can be seen only on a convincing close above 102.00. On the weekly chart, the bullish pattern is seen with a higher low formed last week. To the upside, above 102.00, expect USDJPY to eventually test resistance at 106.00. On the 4-hour chart, we can see a possible pullback to 101.00 – 100.66 ahead of the longer-term move to 106.00.
GBPUSD Daily Analysis
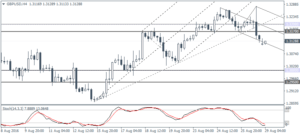
GBPUSD (1.3128): The price action in GBPUSD on Friday saw a downside breakout from the inside bar formed earlier last week and coincides with the resistance level of 1.3200. This is further validated by a hidden bearish divergence on the daily chart as well with the Stochastics posting a higher high against the lower high in price. On the 4-hour chart, resistance is now seen at 1.3170 which could see GBPUSD pull back to. However, the downside target to 1.300 remains in sight. The pullback is validated by the fact that GBPUSD broke down from the previous rising median line followed by a break of the Hagopian line as well. Watch for near term consolidation near 1.3200 – 1.3170 ahead of further declines to 1.3000.
Gold Daily Analysis
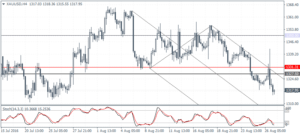
XAUUSD (1317.95): Gold prices were volatile and closed Friday in a doji pattern, but the weekly price action closed with the strong bearish sentiment. Price is seen supported by the lower median line on the daily chart, just a few points above 1315 – 1300 support level. On the 4-hour chart, the resistance at 1331.30 – 1327.50 has been tested and seen by strong price rejection. Gold prices could, therefore, extend their declines to 1300 over the coming days but not ruling out another retest back to 1331.30 – 1327.50 resistance zone.
