EURUSD Daily Analysis
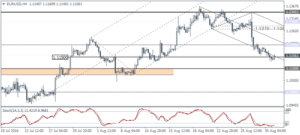
EURUSD (1.1156): EURUSD below 1.1150 yesterday following the near doji type pattern. The strong momentum led declines, however, currently points to a hidden bullish divergence on the daily chart for EURUSD, which implies a near-term correction to 1.1200 – 1.1250. However, there is still scope for EURUSD to continue its declines down to 1.110 where the next main support could be tested. Price action could, therefore, remain range bound within 1.1200 and 1.1150 with the range likely to be broken. To the upside, watch for 1.1270 – 1.1281 resistance zone, while to the downside, 1.1100 remain the key targets.
USDJPY Daily Analysis
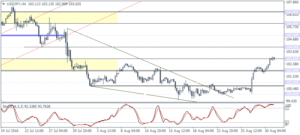
USDJPY (103.02): USDJPY posted strong gains yesterday and managed to break out from the 102.00 resistance level. A pullback could see this resistance being tested for support, and a pending higher low is required to validate the upside move. On the lower time frames, the divergence in the oscillator points to a correction although the depth of the correction could be limited. Still, watch for a pullback in USDJPY either towards 102.00 or 101.00 ahead of further gains.
GBPUSD Daily Analysis
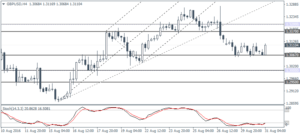
GBPUSD (1.3110): GBPUSD formed an inside bar with the price action staying muted which could indicate a near-term breakout. 1.3200 remains the resistance level that could be tested in the event of a breakout to the upside, while 1.3000 remains the support that could target if the inside bar breaks down lower. On the 4-hour chart time frame, GBPUSD has established support near 1.3067 which could see a retracement back to the resistance zone of 1.3200 and 1.3170. The bias remains to the downside as long as the resistance level is not breached.
Gold Daily Analysis
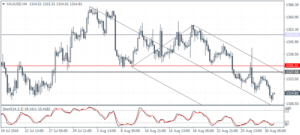
XAUUSD (1314.81): Gold prices fell to 1315.00 support yesterday, but the daily Stochastics formed a lower high, which indicates that the support level could hold the declines for now. Resistance at 1331.30 – 1327.50 still remains a key level for gold prices to pull back to, while to the downside a break below 1315.00 could see gold prices slip lower towards 1300.00 round number support.
