EURUSD Daily Analysis
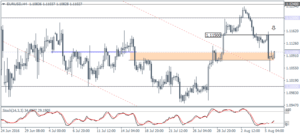
EURUSD (1.1102): EURUSD closed below 1.110 on Friday and price action is likely to continue to the downside, following the hidden bearish divergence that formed earlier on the daily chart. Support is seen at 1.10, and further downside can be expected only on a close below this level. Any short-term corrections to the upside will be limited to 1.110 – 1.1150.
USDJPY Daily Analysis
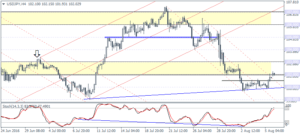
USDJPY (102.02): USDJPY closed Friday on a bullish note following Thursday’s doji pattern. The daily chart shows a higher low being formed last week and the bullish bias could still be validated if the price can close above 102 on a daily session. On the 4-hour chart, there is a hidden bearish divergence that has formed, which could indicate USDJPY staying range bound within 102 – 101 levels in the near term. A breakout from either of these levels could signal further direction.
GBPUSD Daily Analysis
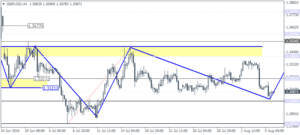
GBPUSD (1.308): GBPUSD has broken to the downside following last week’s price action on Thursday/Friday. The weekly chart continues to show price ranging sideways now into four weeks of completion. The 4-hour chart shows GBPUSD trading within 1.32 – 1.30 support level. The inverse head and shoulders continues to evolve at the current level but would be invalidated on a close towards 1.280.
Gold Daily Analysis
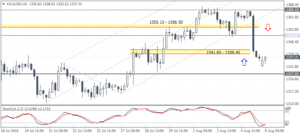
XAUUSD (1337.31): Gold prices broke out from the inside bar range last week as price closed below 1347.20. Any correction to 1347.20 offers a good level to stay on the short side, targeting 1315 – 1300 support. On the 4-hour chart, the hidden bullish divergence has formed near June 27/28 highs of 1341 – 1340 levels and a reversal from here could see gold push back towards 1350 or 1347.20 level. The bias remains to the downside and could be validated if resistance is established near 1350 – 1347 and gold prices could be looking to close lower towards 1327.50 over the week.
