EURUSD Daily Analysis
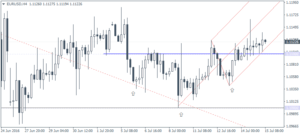
EURUSD (1.112): EURUSD has been bullish for the past two days with price action seen clearing above 1.110 yesterday. Following the break of the inverse head and shoulders pattern yesterday, EURUSD remained largely flat with brief retest back to the broken neckline resistance of 1.110 to establish support. Further upside is likely to see EURUSD inch higher with 1.120 remaining in focus. A breakdown below 1.110 support could, however, invalidate the bullish bias.
USDJPY Daily Analysis
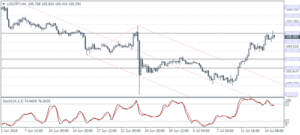
USDJPY (105.59): USDJPY touched 106 resistance and price action is likely to see a pullback. Support at 103 is likely to hold the declines in the near term, which is also confirmed by the hidden bearish divergence. This is more evident on the 4-hour chart. Support zone near 103 – 102 is most likely to be retested following which USDJPY could be seen pushing higher following a subsequent breakout above 106. To the downside, a breakdown below 102 could potentially bring the bearish bias back into the picture.
GBPUSD Daily Analysis
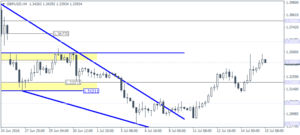
GBPUSD (1.339): GBPUSD cleared the 1.32 resistance on the daily chart with price action now seen testing 1.34. In the near term, a dip back to 1.32 could establish support following which further upside could be seen towards 1.36. Currently, price action is caught near the 4-hour resistance zone of 1.3488 – 1.342 region. Establishing support at 1.32 could pave the way for GBPUSD to potentially close the gap from the Brexit close at 1.36770.
Gold Daily Analysis
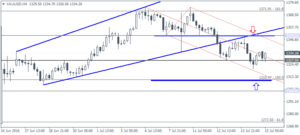
XAUUSD (1334.26): Gold prices posted a 9-day low yesterday testing 1320.31 before pulling back modestly higher. Support at 1327.50 is seen as holding prices which could see a near term correction in gold prices back to the 1350 handle. To the downside below 1327.50, the main support is seen at 1310.50, while to the upside 1350 remains the resistance level in question. A close above 1350 could, however, signal a sharper correction to the upside with gold likely to move back into the 1370 – 1350 range.
