EURUSD Daily Analysis
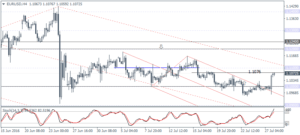
EURUSD (1.1072): EURUSD closed on a bullish note yesterday after the FOMC statement, clearing 1.10 support and now aiming for 1.110 resistance. Price action needs to clear above 1.1076 minor resistance level in order for further gains to be extended. The 4-hour chart shows a hidden bearish divergence currently, and a reversal near 1.1076 – 1.110 could signal a near-term correction back to 1.10 and possibly invalidate further upside.
USDJPY Daily Analysis
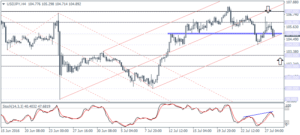
USDJPY (104.89): USDJPY failed to break above 106 resistance, and as noted in yesterday’s commentary, price action is likely to pull back towards 104 – 103.50 support in the near term. This is validated by the hidden bearish divergence which points to a downside correction in the near term. The declines are likely to be limited to 103 – 102 support level at the very best with the bias remaining intact for an upside rally towards 107 followed by 110.00. The bullish bias will be invalidated if USDJPY breaks down below 103 – 102 support in which case 100 remains the next key level of interest.
GBPUSD Daily Analysis
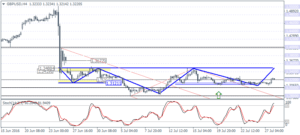
GBPUSD (1.322): GBPUSD has managed to break out from the bullish pennant that has formed on the daily chart with price cleared above 1.32. Further upside can be expected with the initial price of 1.34 likely to be challenged. The upside breakout indicates that the 4-hour head and shoulders pattern has failed following the strong support formed near 1.3127 and 1.3085. Price has also consolidated into a longer term inverse head and shoulders pattern on the 4-hour chart with the neckline resistance at 1.35 – 1.340. A breakout above this resistance will see GBPUSD extend its gains towards 1.40 at the very least. To the downside, a close below 1.30 will invalidate this potential bullish expectation.
Gold Daily Analysis
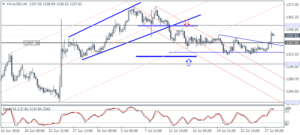
XAUUSD (1337.60): Gold prices broke out to the upside yesterday closing at 1339.92. The gains come following days of multiple tests at 1315 support. Resistance is now seen at 1350. On the 4-hour chart, we can see the upside breakout from the descending triangle pattern. Any pullback is limited towards 1327.50. Gold prices are likely to see a near-term top being established near 1350 with the bias remaining to the downside. This view can change only on a daily close above 1350 with bullish conviction. To the downside, if the pullback fails to stall near 1327.50, expect gold to slide back to 1315 and eventually to 1310 putting the bullish bias into question.
