EURUSD Daily Analysis
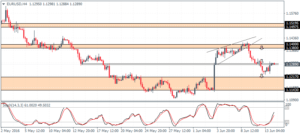
EURUSD (1.128): EURUSD closed bullish yesterday after gapping lower. Price is back to 1.130 support that was broken on Friday and below the inside bar’s lower range of 1.1325. A break above this price level could see EURUSD move back into the range with the likelihood of another test to the upside near 1.1392 – 1.140. On the 4-hour chart, EURUSD is seen trading back near the minor support level that was formed at the above mentioned levels. A break higher could see prices extend gains to retest the upper resistance level. To the downside, 1.12170 support will be key. A break lower could see price consolidate within 1.1217 and 1.1143.
USDJPY Daily Analysis
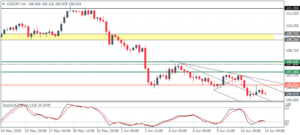
USDJPY (106.0): USDJPY was bearish yesterday with the price falling back into 106.27 – 105.60 support level. The momentum is however seen to be slowing down at the current support, which could keep prices supported for the moment. However, the risk of a downside continuation could see USDJPY test 105 levels and probably lower. On the 4-hour chart, price action continues to evolve following the break of the descending triangle pattern. The base support at 106.53 – 106.60 level will be key. Failure to break this support turned resistance could signal further downside.
GBPUSD Daily Analysis
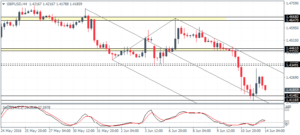
GBPUSD (1.418): GBPUSD closed in a doji yesterday near 1.420 support. However, current price action is looking quite bearish. Prices could remain limited within 1.420 – 1.4053 should we see a downside continuation. A close below yesterday’s low at 1.4115 could extend further declines. On the 4-hour chart, support is seen formed near 1.4148 – 1.41170, while the Stochastics is likely to form a bullish divergence. Failure to find support on a retest of this level could see GBPUSD prepare for more downside. Alternately, if the support holds, we could expect a retracement to 1.435 – 1.4358 resistance.
Gold Daily Analysis
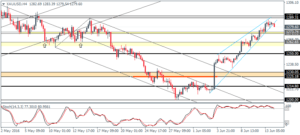
XAUUSD (1279): Gold prices rallied to new highs of 1287 yesterday, and we could expect a test to 1290 in the near term. However, the further upside cannot be expected unless we see price break above the $1300 handle. On the 4-hour chart, gold continues to trade in a sharp uptrend, but downside looks supported above 1273 – 1271 resistance level that was broken, leaving gold to move sideways within 1291 – 1289 resistance and 1273 – 1271 support.
