EURUSD Daily Analysis
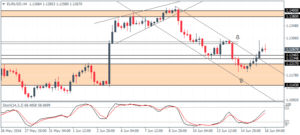
EURUSD (1.126): EURUSD bounced off the 1.120 support level and looks to be ranging within 1.130 and 1.120 levels. The minor resistance at 1.130 – 1.1285 was tested briefly yesterday with prices being rejected at this level. A break above 1.130 is required for EURUSD to extend its gains towards 1.1380. To the downside, prices are likely to remain range bound above 1.1217 levels. A break below this support could see EURUSD test the lower end at 1.11430. We could, therefore, expect EURUSD to remain range bound in the near term with further gains or declines coming on a break of the respective resistance or support levels.
USDJPY Daily Analysis
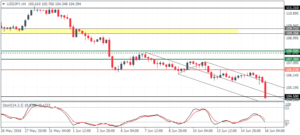
USDJPY (104.3): USDJPY has broken down below 105.60 – 106.27 support levels on the daily chart and price action is now trading closer to 104.50 levels. The further downside could see USDJPY extend its declines to 104 lows. On the 4-hour chart, the Stochastics is pointing to a possible bullish divergence but needs to be confirmed. A correction here could see USDJPY retrace some of its declines.
GBPUSD Daily Analysis
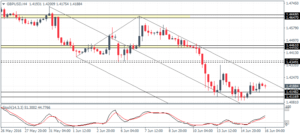
GBPUSD (1.418): GBPUSD managed to find support near 1.4113 at the doji’s low formed three days ago. However, resistance at 1.42 is proving hard to break out from which could keep GBPUSD hovering sideways in the near term. Only a break above 1.42 could extend gains towards 1.4425 levels. To the downside, declines could be limited to 1.40530. On the 4-hour chart, we can see that GBPUSD has been forming a base near 1.4148 – 1.41170 support which could limit the declines for now while price could test the resistance to 1.435 on a break above 1.420.
Gold Daily Analysis
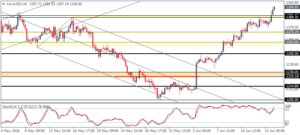
XAUUSD (1300): Gold is currently testing the $1300 handle and marks 6-straight days of gains. Further upside could see gold moving towards the 1310 – 1320 resistance levels while the downside looks limited with prices trading above the 1290 – 1291 resistance level, which could be tested for support on a dip. In the near term, 1303 – 1300 marks a strong resistance, which was previously formed in early May and further upside can be expected only on a break above this minor resistance.
