EURUSD Daily Analysis
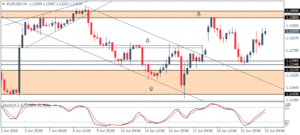
EURUSD (1.133): EURUSD has reversed its previous losses and remains trading at Monday’s open near 1.13359. Further upside is likely if support is found near 1.130 and the previous minor resistance high at 1.1392 from 6 June remains a key level, which if broken could see EURUSD extend gains towards 1.140 – 1.1470. Overall, EURUSD remains range bound within 1.14 and 1.13 as noted in yesterday’s note and the breakout could coincide with the release of the UK’s referendum results tomorrow at 0900 UK time.
USDJPY Daily Analysis

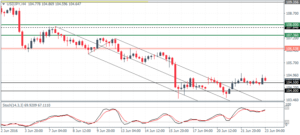
USDJPY (104.6): USDJPY remains range bound, now into its fifth day and trades below the key broken support at 105.6 – 106.27 which could act as resistance. On the 4-hour chart, prices have established a base near 104.5 – 104.0 level, leaving room for a short term correction to the identified resistance level. A break above 106.27 is essential for USDJPY to seek out further gains targeting the next minor resistance at 107 and eventually to 109 if prices can fall back to establish support near 106.270. To the downside, a break below 104 could see USDJPY turn bearish, targeting 103 and 102 round number supports.
GBPUSD Daily Analysis
GBPUSD (1.479): GBPUSD continues to push higher, but the current break above 1.4743 – 1.4635 resistance zone does not look convincing enough. There is a risk of a dip back to 1.4425 level through 1.43605, which marks the unfilled gap from this Monday’s price action. On the 4-hour chart, GBPUSD has been consolidating into a rising wedge pattern that could see a breakout lower. Support at 1.4668 – 1.4647 remains key in this aspect as a break below this support could see further downside to the identified lower support levels as well as 1.4360.
Gold Daily Analysis
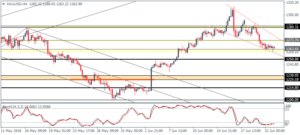
XAUUSD (1263.90): Gold prices continue to edge lower marking a two day decline, but the slowing momentum is indicative of a possible short term correction. Prices remain capped below $1300 which could act as a strong resistance level. On the 4-hour chart, gold remains trading within the falling wedge pattern with prices trying to establish support at 1262. A breakout above 1273 will be needed for gold prices to extend their gains towards 1290 region, failing which; further downside can be expected with 1250 in sight.
