EURUSD Daily Analysis
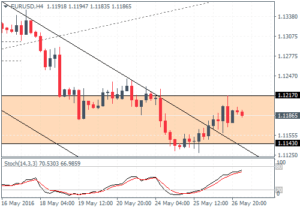
EURUSD (1.118): EURUSD closed bullish yesterday but failure to close above 1.1219 high from two days ago is likely to keep price action biased to either direction. On the 4-hour chart, the price has broken out from the falling price channel, but failure to rise above 1.1217 could see EURUSD range within the price zone of 1.1217 – 1.1143. Only a bullish close above 1.1217 will see further upside in EURUSD towards 1.138 while to the downside, a close below 1.1143 could see prices fall towards 1.110 round number barrier.
USDJPY Daily Analysis
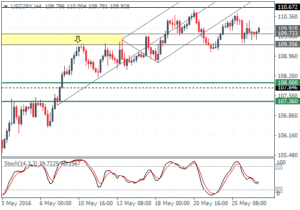
USDJPY (109.9): USDJPY closed bearish yesterday with price action trading flat for nearly 7 consecutive days. Resistance is capped by the 50 day EMA, which could see price rally towards 110.67 if the level breaks. Support at 109.73 – 109.35 has held the declines strongly so far limiting the downside. Only a break down below 109.35 will validate a decline to 108 – 107.36 while to the upside 110.67 – 111.31 remains a likely price zone that could be targeted.
GBPUSD Daily Analysis
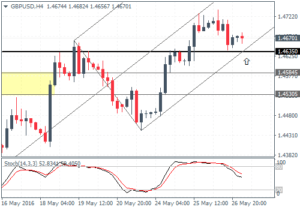
GBPUSD (1.467): GBPUSD remains trading within the range of 1.4743 – 1.4635. The upside is limited unless there is a strong bullish close above 1.4743 which will then clear the way for a move to 1.48. To the downside, price action could see a possible decline to 1.4425 if the current support at 1.4635 fails. On the 4-hour chart, the support at 1.4635 is likely to be tested ahead of what could be a further rally, but on a close above 1.4712.
Gold Daily Analysis
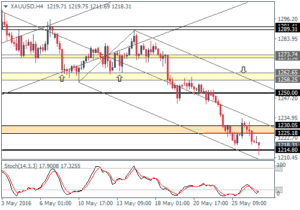
XAUUSD (1218): Gold prices resumed their bearish momentum yesterday with prices briefly testing 1231.50 before giving up the intraday gains and closing bearish after 1225 support failed. Price action is currently testing the lows at 1214. A break below this level could see a move towards 1210 and 1200 eventually, but the Stochastics shows a bullish divergence taking shape. A retracement above 1230 could see a potential move to 1250 in the near term.
