EURUSD Daily Analysis

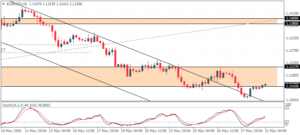
EURUSD (1.115): EURUSD closed with a modestly bullish note yesterday following the strong bearish candlestick on Friday. The reversal is likely to see a near term retracement in prices, with 1.120 price level coming in as the first level that could be tested for resistance. On the 4-hour chart, price action is currently flat with a moderate rally in prices. The Stochastics has moved out of oversold levels. Only a clean break above 1.120 – 1.12170 and establishing support at this level will see further upside towards 1.1380 resistance zone.
USDJPY Daily Analysis
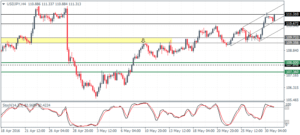
USDJPY (111.3): USDJPY continues to edge higher with price action now aiming for the 111.43 – 112.0 level of resistance. Unless prices go for a clean break above this resistance level USDJPY could be looking for a dip towards 107.95 – 108.0 support on a retracement. The 4-hour chart shows prices in the resistance zone currently with the Stochastics pointing to a hidden divergence near this resistance. 109.73 -109.35 will be the first support level of interest to the downside ahead of a correction to 108.
GBPUSD Daily Analysis
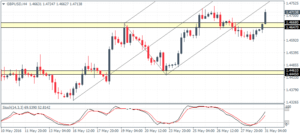
GBPUSD (1.471): GBPUSD is currently bullish, but prices are in the resistance zone of 1.4743 – 1.4720. Further continuation to the upside is possible only on a close above 1.4743 with a bullish candlestick pattern confirming further upside in prices. Support at 1.4461 – 1.4445 will be likely holding out any short term dips. Above 1.4743, the next resistance is at 1.48.
Gold Daily Analysis
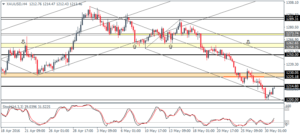
XAUUSD (1213): Gold prices fell through to test the 1200 support yesterday and with prices holding at this support so far, a near term rally cannot be ruled out. 1231.50 is the first level of resistance to the correction followed by 1264. On the 4-hour chart, 1214.80 is likely to act as a minor resistance level, and only a break above this resistance will see a continuation to the upside. To the downside, 1200 support could be tested if the 1214.80 resistance holds, but price action could stay flat. A break below 1200 could see gold prices fall towards 1180 – 1190 region.


