EURUSD Daily Analysis
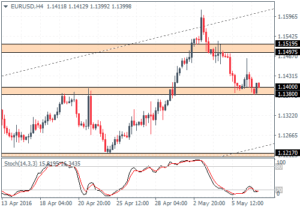
EURUSD (1.13): EURUSD closed Friday with a doji pattern with the highs briefly testing 1.1470. A daily close below the doji’s low at 1.1386 could signal further declines in prices. On the 4-hour chart, rice action is sitting right near the 1.140 – 1.1380 support level, which if holds could see another move to the upside to test 1.1519 – 1.1497 resistance. A close above 1.1519 could, however, see further bullishness in prices, while to the downside, support failure at 1.1380 could see a move to 1.12170.
USDJPY Daily Analysis
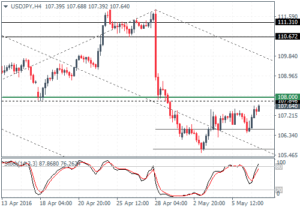
USDJPY (107.6): USDJPY is currently struggling to clear 107.955 resistance following Friday’s spinning bottom candlestick pattern. A close above 107.955 is needed for the price to confirm further upside, while to the downside, we could expect some ranging price action. On the 4-hour chart, following the hidden divergence, price action fell to 106.60 support and is now attempting another move to the upside. Resistance near 108 – 107.955 will be key for further upside in USDJPY.
GBPUSD Daily Analysis
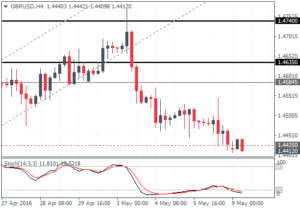
GBPUSD (1.44): GBPUSD is back near the support at 1.4425. If the support fails, we could expect to see further downside in prices with an eventual move lower to test 1.420 support. If the current support holds, GBPUSD could be looking higher in the near term. On the 4-hour chart, price action is currently near the minor support at 1.44250. Any bounces off this support are likely to stay limited in the near term for the resistance at 1.4584 while 1.4312 – 1.430 will be the lower support that could hold prices.
Gold Daily Analysis
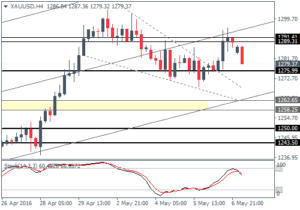
XAUUSD (1279): Gold prices are currently moving lower following Friday’s bullish close. Support at 1275.90 will be likely tested on the downside. If the support holds, Gold is likely to stay range bound above 1275.90 and resistance at 1291 – 1289. On the 4-hour chart, the bullish breakout remains in play but subject to price clearing the above resistance. If the lower support fails, gold prices could slip sharply falling to 1262.65 – 1250 level of support.
