EURUSD Daily Analysis
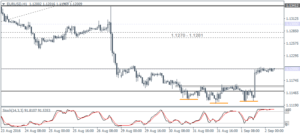
EURUSD (1.1200): EURUSD closed bullish yesterday with prices seen testing 1.1200 resistance level. The hidden bullish divergence on the daily chart could indicate a near-term continuation subject to price clearing the 1.1200 resistance level. On the 1-hour chart, as noted yesterday, prices pulled back lower to form a higher low before posting strong gains to reach 1.1200. The 1-hour chart now shows a potential cup and handle pattern that could be formed if prices remain consolidated at the current levels unless price breaks out strongly higher. In any case, watch for a pullback towards 1.1175 – 1.1150, ahead of further gains to the resistance level of 1.1270 – 1.1281.
USDJPY Daily Analysis
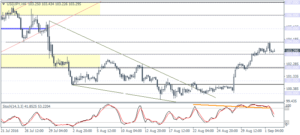
USDJPY (103.29): USDJPY barely managed to test 104.00 resistance before pulling back lower to the close the day at 103.23. Support is now seen near 102.00, which could form a higher low. Although USDJPY looks poised to the downside in the near term, the long term bias remains to the upside with a potential test towards 108.00. Also, note the potential head and shoulders continuation pattern that is forming. A break down below 100.00 could signal further downside in USDJPY on the daily chart.
GBPUSD Daily Analysis
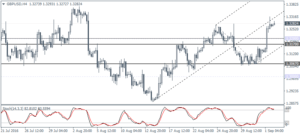
GBPUSD (1.3282): GBPUSD managed to break out above 1.3200 yesterday after the manufacturing PMI surprised to the upside. Further gains could be seen pushing GBPUSD towards 1.3400. However, watch for a pullback towards 1.3200 – 1.3170, or a breakout above 1.33 currently which could keep the bullish momentum going.
Gold Daily Analysis
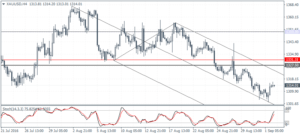
XAUUSD (1314.01): Gold prices were seen trading near the 1315 – 1300 support zone that was identified. But the breakout from the rising median line signals further downside. Watch for a rally back to the 1331.30 – 1327.50 resistance level which could be tested in the near term. This is also validated by the bullish divergence seen on the 4-hour time frame.
