EUR/USD suffered from the dollar’s strength falling below the post-Brexit highs that it struggled to break. The next move depends on the monthly close:
Here is their view, courtesy of eFXnews:
Monthly MACD histograms are stretched for USD crosses
The number of bearish US dollar monthly MACD crosses by our count has never been this high. Now just three of the thirty pairs below have not crossed bearish. They include USD/MXN, USD/GBP and USD/CNH. However we have noticed that many of the monthly trends according to the MACD histogram are at record extremes as August nears a close. This suggests some tactical USD strength is possible
USD Cumulative AD line made new low before bounce
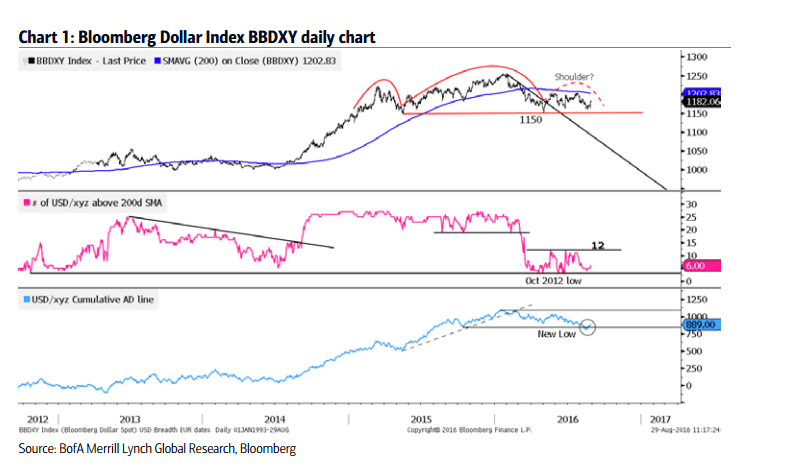
Breadth warns this may only be a tactical USD rally. The USD rally after Jackson Hole prevented the major US dollar indices from breaking the neckline of a head and shoulders top, like the Bloomberg Dollar Index in Chart 1. Looking across 27 USD crosses, only six are above their 200d SMA. In aggregate, USD crosses have been declining much more than advancing. This is shown in Chart 1 by the AD line making a new low in mid-August.
Bearish monthly MACD’s put USD at risk longer term.
Chart 2 shows USD tends to struggle after a large number of bearish MACD crosses. There are three times in history when a large number of bearish signals occurred in about a year’s time. The DXY index (green) declined further into 1995 and collapsed in 2002. In 2009 it fell to a lower low, rallied and failed to break the 2009 high and then declined to another new low in 2011. The US trade weighted dollar index (magenta) only consolidated in 1995 suggesting USD was equal performing a broader basket. It also collapsed in 2002. In 2010 it rallied less than the DXY before making a new low.
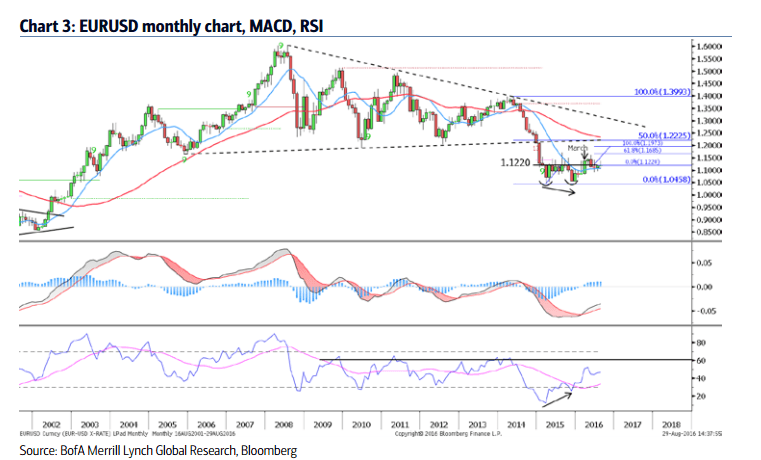
The euro’s direction is key for DXY
The euro is 57.6% of the DXY. In March it made a bullish close through resistance and in April formed a bearish candle pattern called a ‘hanging man’. This is like the popular ‘hammer’ candle after a decline except it’s located after a rally. EUR/USD declined in May to test and close above the 12m SMA. Since then spot has ended each month above the 12m SMA which is currently at 1.1060.Technically, provided EUR/USD remains above the 12m SMA then the March breakout is still considered valid.
For lots more FX trades from major banks, sign up to eFXplus
By signing up to eFXplus via the link above, you are directly supporting Forex Crunch.
