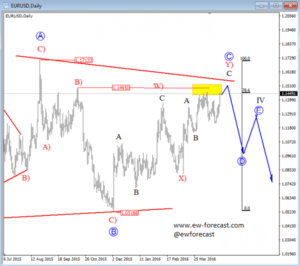
EURUSD is moving higher since the start of December 2015, reaching 1.1500 area where the upside can be limited as recovery from 1.0518 is in seven legs. That’s a structure of a corrective price action, so ideally it represents wave C-circled as part of a big triangle in black wave IV. Notice that for now the price is still on the rise but it may turn down from 78.6% Fibonacci resistance level, so maybe wave D will finally show up in May.
EURUSD, Daily
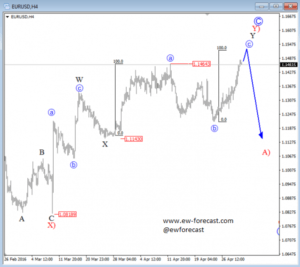
On the lower time frame, EURUSD moved sharply to the upside at the end of last week, back above 1.1464 so the bullish swings are still here, but because of the overlapping price action since the start of March, we still see recovery as a complex correction. We are looking at a double zigzag up from 1.0818 shown on the 4h chart, that represents part of a big blue wave C-circled as the third leg within an ongoing triangle on a daily chart. Based on the price and time, we suspect that EURUSD can show evidence of a turning point in the start of May.
EURUSD, 4H