EURUSD Daily Analysis
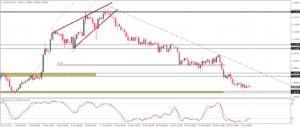
EURUSD (1.08): EURUSD is attempting to test the lower support identified at 10935 – 1.0825 with the test of this support so far being tested by price rejection. A firm test with closing prices at this level will signal a possible move back to the upper resistance at 1.093 – 1.095. Below 1.0825, EURUSD could be looking to test the previous lows near 1.056 region. The Stochastics continues to print a possible higher low, which if confirmed by the bullish divergence and the break of the falling trend line, EURUSD could be looking to correct towards 1.11 if prices manage to break above 1.095 – 1.093 support.
USDJPY Daily Analysis
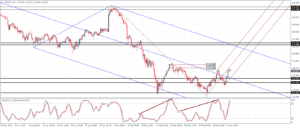
USDJPY (113.9): USDJPY has managed to close on a bullish note yesterday but prices look to be capped by the dynamic resistance of the 20-day moving average. A test back to 112, in this case, cannot be ruled out as a result. The daily chart Stochastics shows a hidden bearish divergence with the oscillator printing a higher high against price’s lower high, pointing to another test to the downside. Currently, prices have formed a doji near 113.9 region and a lower close could see USDJPY test the 113 – 112.5 support. A breakout from the rising median line could potentially signal a move lower towards 111.31 region.
GBPUSD Daily Analysis
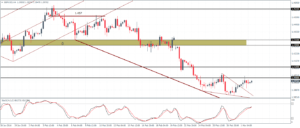
GBPUSD (1.396): GBPUSD has posted two days of gains off the 1.386 lows. Prices, however, remain below the recent highs made at 1.404. We expect a continuation of the sideways pattern as prices remain capped below the 1.40 resistance. On the 4-hour chart, the breakout from the possible consolidating descending triangle hasn’t shown any strong moves indicating the potential for a downside risk if prices fail to close above 1.40.
Gold Daily Analysis
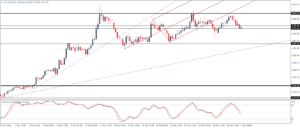
XAUUSD (1227): Gold prices have been pushing lower after prices briefly tested the 1246 highs yesterday. The strong consolidation continues to keep prices flat with the potential to break out strongly. Currently, support at 1230 – 1225 is holding prices but a break below this level with convincing close could see another dip to the 1200 region. Below 1200, 1130 support comes into the picture.
