EURUSD Daily Pivots
| R3 | 1.118 |
| R2 | 1.111 |
| R1 | 1.1064 |
| Pivot | 1.0995 |
| S1 | 1.0947 |
| S2 | 1.0878 |
| S3 | 1.0832 |
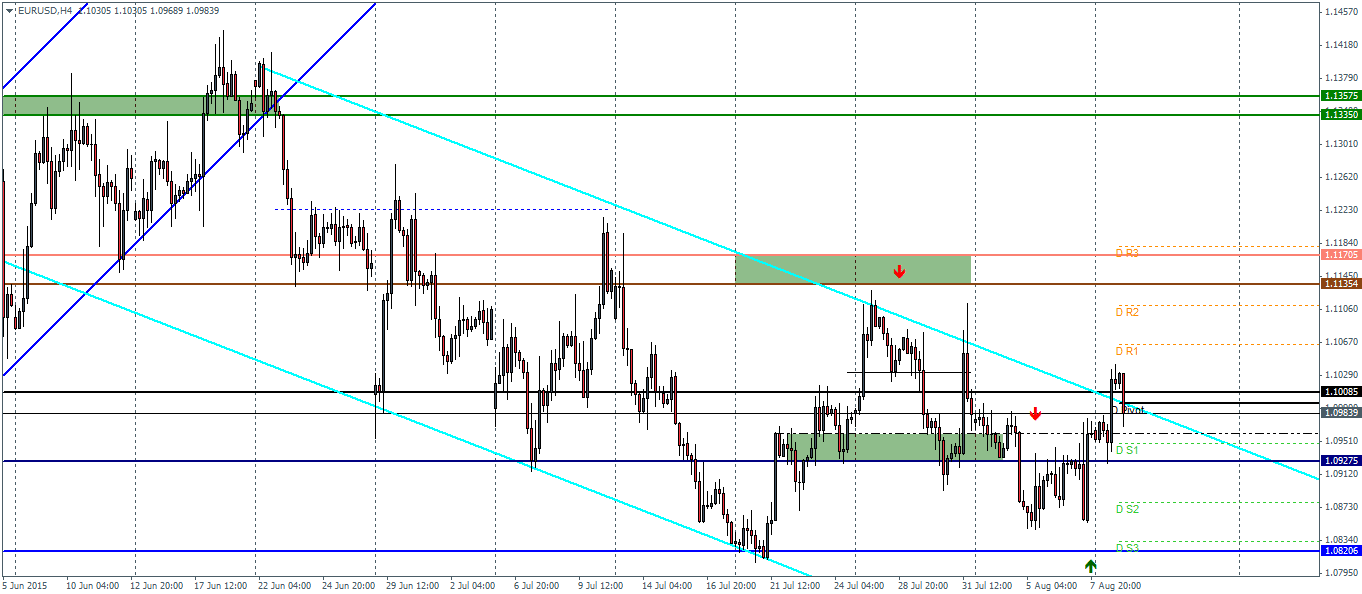
EURUSD (1.09): EURUSD rallied back above the 1.10 handle yesterday and on the intraday charts, we see price trading above the support level near 1.095 and 1.09275. The single currency has posted four straight sessions of gains on the daily charts after testing the lows near 1.085. A test to this support is very likely, which could potentially see a new short term bias being established. To the upside, on a successful test of support, we could expect a break out from the falling price channel and thus expect EURUSD to attempt to target the upper resistance at 1.1135. Alternatively, if the support gives way, EURUSD could see a decline to 1.082 support.
USDJPY Daily Pivots
| R3 | 125.518 |
| R2 | 125.142 |
| R1 | 124.891 |
| Pivot | 124.525 |
| S1 | 124.264 |
| S2 | 123.898 |
| S3 | 123.636 |
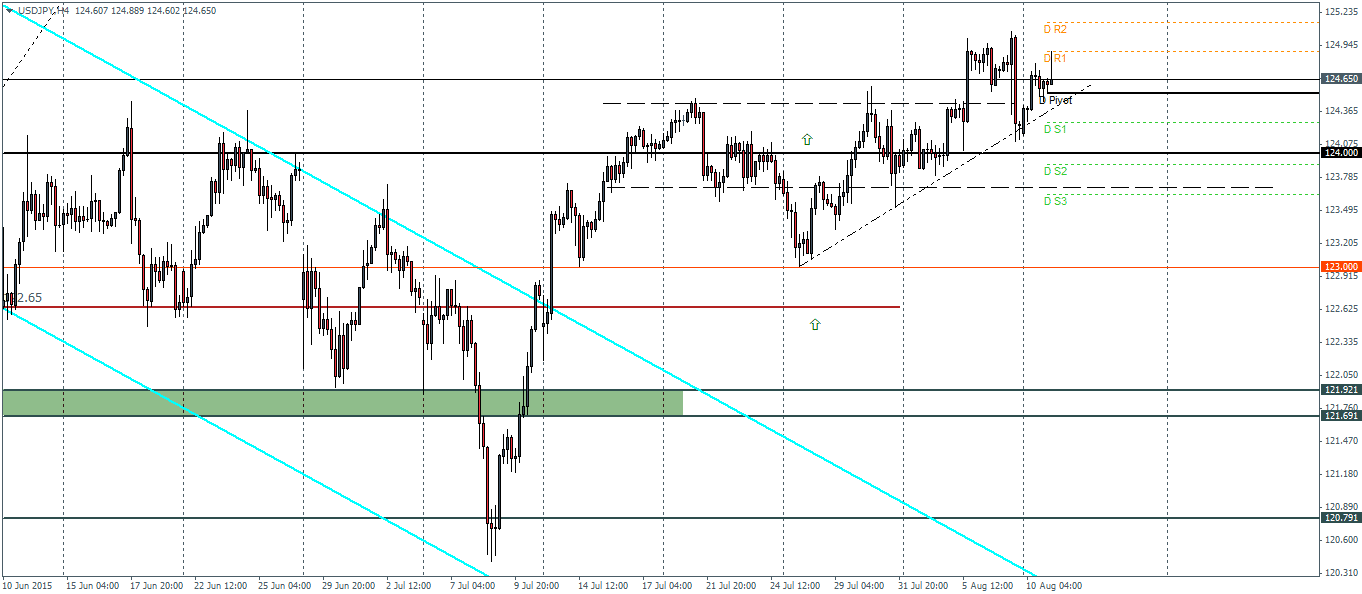
USDJPY (124.6): USDJPY is seen consolidating near the 124.775 level of support/resistance. Price action is seemingly well supported above the rising trend line which has been readjusted and we expect the support level near 124.35 to hold. This would see USDJPY rally above the previous highs near 124.995 to test the resistance at 125.650. Alternatively, a break of the readjusted trend line could see support come in at 124 region followed by the lower support at 123.70.
GBPUSD Daily Pivots
| R3 | 1.5790 |
| R2 | 1.57 |
| R1 | 1.5647 |
| Pivot | 1.5552 |
| S1 | 1.5499 |
| S2 | 1.5404 |
| S3 | 1.5351 |
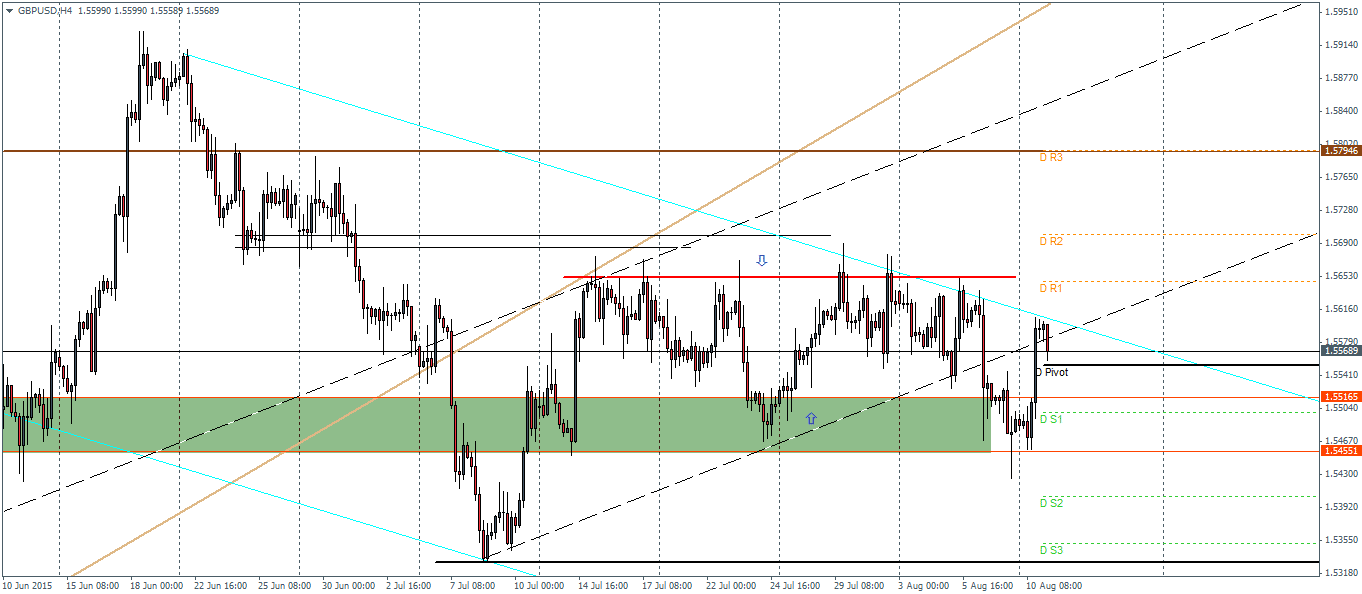
GBPUSD (1.55): GBPUSD reversed off the major support level near 1.5516 through 1.5455 yesterday. However, the current reversal levels that we notice near the rising price channel could see a further downside in store on break of the major support. The falling price channel is now readjusted to capture the previous price action as well and this shows that another test to 1.551 – 1.5455 will be very likely. Price action near the support will indicate the short term bias as a break of support could see a test down to 1.533, while to the upside, the previous strong resistance at 1.565 will be tested ahead of further gains.
