EURUSD Daily Pivots
| R3 | 1.1238 |
| R2 | 1.1164 |
| R1 | 1.112 |
| Pivot | 1.1046 |
| S1 | 1.1001 |
| S2 | 1.0927 |
| S3 | 1.0882 |
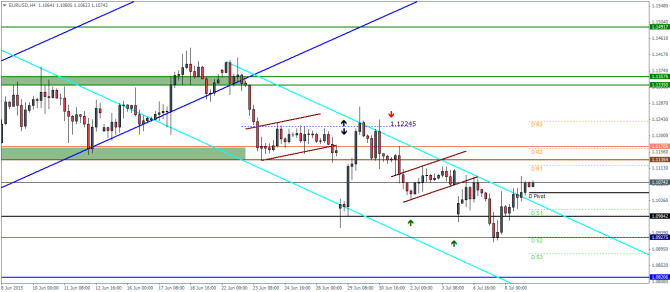
EURUSD (1.107): EURUSD saw an up day yesterday with prices testing 1.097 lows and being rejected. On the intraday chart, price has just broken out from the falling price channel and we expect a minor retest back to the breakout level, near the daily pivot at 1.105. A successful test here could mean that EURUSD could set the stage for a rally to test the previous broken support at 1.117 – 1.1135 to establish resistance. In the event that prices break above the broken support, failing to establish as resistance, EURUSD could then set eyes for targeting 1.12245 and eventually to 1.13575 – 1.13350.
USDJPY Daily Pivots
| R3 | 124.204 |
| R2 | 123.378 |
| R1 | 122.04 |
| Pivot | 121.227 |
| S1 | 119.877 |
| S2 | 119.064 |
| S3 | 117.725 |
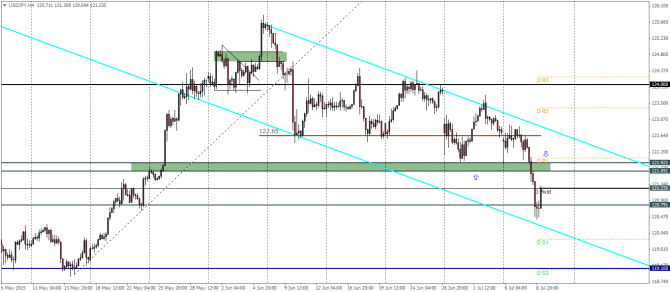
USDJPY (121.3): USDJPY continues to remain weak with yesterday’s candlestick closing on a very bearish note. Price broke below the 121.484 level of support in yesterday’s trading session. The intraday chart for USDJPY shows a possible test to the broken support at 121.7 – 122 region being retested to establish resistance. If price fails to rally over this zone, we could expect a break of the lower support at 120.8 region. Below 120.8, the next support comes in at 119.1. Alternatively, if prices rally back above 122, we could expect USDJPY to break out from the falling price channel with the aim to rally back to 124.
GBPUSD Daily Pivots
| R3 | 1.5578 |
| R2 | 1.5526 |
| R1 | 1.5440 |
| Pivot | 1.5384 |
| S1 | 1.5304 |
| S2 | 1.5248 |
| S3 | 1.5166 |
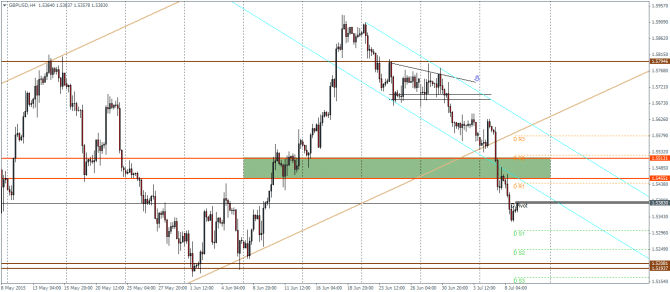
GBPUSD (1.538): GBPUSD continued its decline yesterday with price stalling just a few points off 1.5324 level of support on the daily charts. Any bounce to the upside could see sellers likely to enter the market and push prices to make a clear test down to 1.5324. On the intraday charts, price has clearly broken to the downside of the falling price channel with a retracement currently in place. A test back to 1.5455 level of broken support to test for resistance could see a continuation to the downside. The intraday chart shows that the next level of support comes in at 1.52. Alternatively, if price heads back into the falling price channel, it could be an early indication of a possible rally, provided the support at 1.551 – 1.5455 is taken out.
