EURUSD Daily Analysis
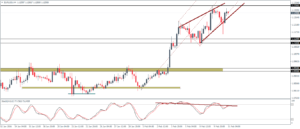
EURUSD (1.12): EURUSD closed with a long legged doji candlestick pattern yesterday after testing lows of 1.116. Price action remains caught within the 1.12 – 1.13 level of resistance with price action currently trading just below the 1.13 handle. O the 4-hour chart, the rising wedge pattern remains in play and if the previous high is not breached near 1.1336, a potential move to the downside could be anticipated, with a test of support to 1.11 very likely which will be confirmed on a break out from the rising wedge pattern. The median line plotted on the recent price action also showed a modest lower high being formed but price needs to follow through with the 4-hour Stochastics printing a bearish divergence currently.
USDJPY Daily Analysis
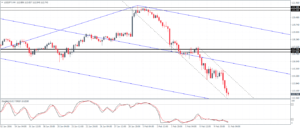
USDJPY (112.6): USDJPY erased intraday gains yesterday and remained in a bearish mode. Prices closed lower below the 113 handle. 112 is the next major level of interest for any hopes of a correction to the upside, failing which price action could continue to push lower. The 4-hour chart shows the down sloping price channel which could indicate a move higher if prices manage to break out from it. For the moment, USDJPY remains weak with 112 very likely to be tested in the near term.
GBPUSD Daily Analysis
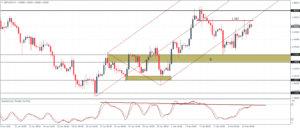
GBPUSD (1.45): The British Pound pushed higher after finding minor support off the 1.443 support. The bounce saw prices rally to test the 1.457 where a minor support is now being tested for resistance. If GBPUSD remains below 1.457, price action could decline lower with 1.435 – 1.43 coming in as a level of support that could be tested. The 4-hour Stochastics oscillator is also failing to confirm the highs indicating a potential correction to the downside if prices fail to break above 1.457.
Gold Daily Analysis
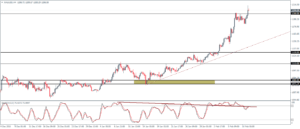
XAUUSD (1205): After the doji candlestick pattern on the daily session two days ago, Gold managed to break higher and cleared the 1200 handle. However, further upside is unlikely to materialize as the 4-hour chart shows a strong bearish divergence being built up with the Stochastics failing to confirm the highs. Support at 1130 to the downside comes into question, followed by a correction to 1110 on a further break below.
