The GBP/USD kicked off the new week with another weekend gap, this time to the downside as there are concerns that the British government is torn over the Brexit approach. After slipping below 1.2900, what’s next?
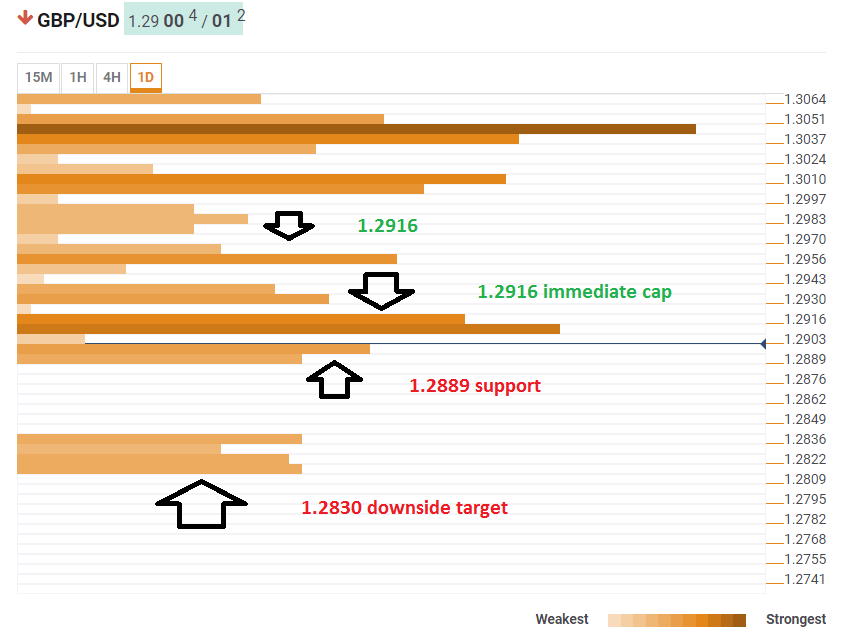
The Technical Confluences Indicator shows that cable has some support at 1.2889 where we see the convergence of the Pivot Point one-month Support 1, the previous hour’s low, the Bollinger Band 1h-Lower, and the PP one-day Support 2.
Further down, we see a cluster of support around 1.2830 which includes the Fibonacci 23.6% one-month, the PP one-week Support 2, and the PP one-week Support 3.
Looking up, immediate resistance awaits at 1.2916 which is the confluence of the Fibonacci 38.2% one-month, the previous 15m-high, and the Simple Moving Average 5-15m.
Further up, 1.2956 is notable: the SMA 100-4h, the SMA 10-one-day, the BB 15m-Upper, and the previous 4h-high converge.
This is how it looks on the tool:
Confluence Detector
The Confluence Detector finds exciting opportunities using Technical Confluences. The TC is a tool to locate and point out those price levels where there is a congestion of indicators, moving averages, Fibonacci levels, Pivot Points, etc. Knowing where these congestion points are located is very useful for the trader, and can be used as a basis for different strategies.
This tool assigns a certain amount of “weight” to each indicator, and this “weight” can influence adjacents price levels. This means that one price level without any indicator or moving average but under the influence of two “strongly weighted” levels accumulate more resistance than their neighbors. In these cases, the tool signals resistance in apparently empty areas.
