GBP/USD has risen after Fed Chair Jerome Powell opened a wide door to cutting interest rates and sent the dollar down. How is the currency pair positioned? Significant support provides favorable conditions.
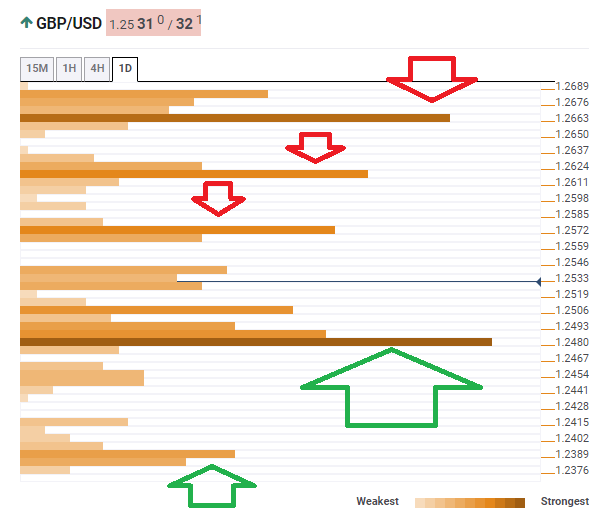
The Technical Confluences Indicator shows that GBP/USD enjoys significant support at 1.2480 where a cluster of lines awaits it. The area includes the Fibonacci 61.8% one-day, the previous yearly low, the previous weekly low, the Bollinger Band one-hour Middle, and the Simple Moving Average 5-4h.
The first upside target is 1.2572 where we see the convergence of the SMA 200-1h and the Fibonacci 38.2% one-week.
Further up, cable may target 1.2618 which is the confluence of the Pivot Point one-day R3 and the Fibonacci 61.8% one-month.
The final upside target is 1.2663 which is a considerable resistance line and where we see the SMA 10-1d converge with the PP 1w-R1.
If GBP/USD falls below 1.2480, the next cushion is only at 1.2389 where we see the Fibonacci 161.8% one-day, the PP 1m-S2, and the PP 1d-S3 converge.
This is how it looks on the tool:
Confluence Detector
The Confluence Detector finds exciting opportunities using Technical Confluences. The TC is a tool to locate and point out those price levels where there is a congestion of indicators, moving averages, Fibonacci levels, Pivot Points, etc. Knowing where these congestion points are located is very useful for the trader, and can be used as a basis for different strategies.
This tool assigns a certain amount of “weight” to each indicator, and this “weight” can influence adjacents price levels. This means that one price level without any indicator or moving average but under the influence of two “strongly weighted” levels accumulate more resistance than their neighbors. In these cases, the tool signals resistance in apparently empty areas.
