GBP/USD extended its gains on Brexit hopes and feels comfortable above 1.3000. Where next?
The Technical Confluences Indicator shows that cable is facing significant resistance at around 1.1369, where we see the convergence of the Fibonacci 161.8% one-month, the Bollinger Band 15-minute Lower, the BB 1h-Middle, the Simple Moving Average 5-15m, the SMA 10-15m, the BB 15-minutes Middle, and the SMA 50-15m.
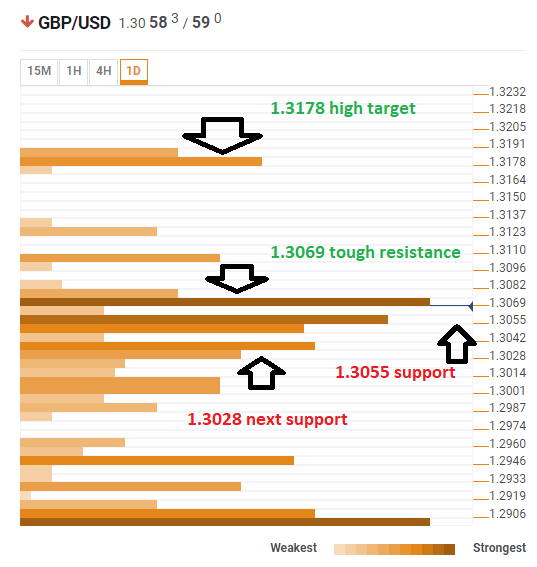
If the pair overcomes this level, it has quite a lot of room to run. The next noteworthy confluence is around 1.3178 where we see the Pivot Point one-day Resistance 2 and the PP one-week R2.
Looking down, GBP/USD has support at around 1.3055 and a bit below where we see the PP one-month Resistance 2, the BB one-day Upper, the SMA 100-15m, and the Fibonacci 23.6% one-day.
The next cushion is not so far either. At 1.3028 we see the meeting point of the Fibonacci 38.2% one-day, the BB 1h-Lower, and the PP one-week R1.
This is how it looks on the tool:
Confluence Detector
The Confluence Detector finds exciting opportunities using Technical Confluences. The TC is a tool to locate and point out those price levels where there is a congestion of indicators, moving averages, Fibonacci levels, Pivot Points, etc. Knowing where these congestion points are located is very useful for the trader, and can be used as a basis for different strategies.
This tool assigns a certain amount of “weight” to each indicator, and this “weight” can influence adjacents price levels. This means that one price level without any indicator or moving average but under the influence of two “strongly weighted” levels accumulate more resistance than their neighbors. In these cases, the tool signals resistance in apparently empty areas.
