GBP/USD jumped up and down as Parliament rejected no less than eight alternatives and as PM Theresa May offered her resignation after her accord is approved. What’s next for cable?
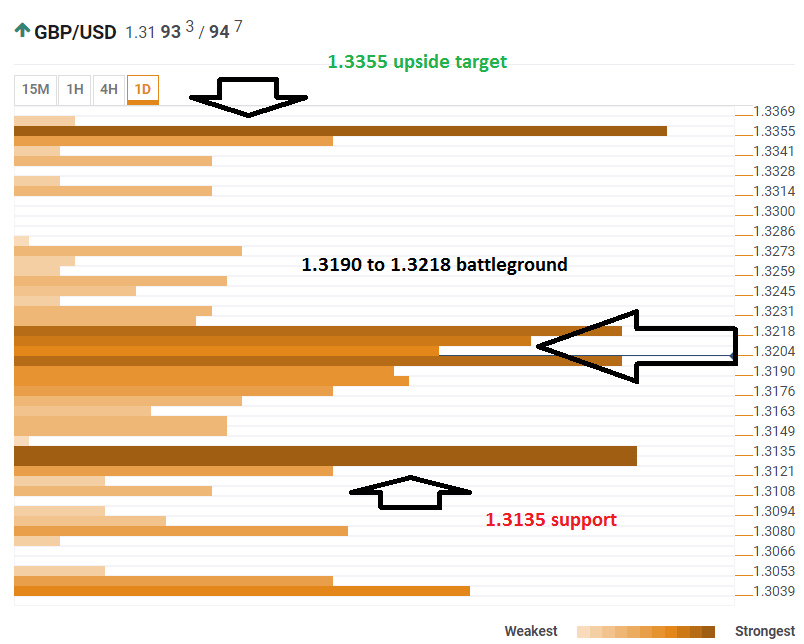
The Technical Confluences Indicator shows that pound/dollar is stuck in a range between 1.3190 and 1.3218. The area is a minefield of technical levels including the Fibonacci 23.6% one-day, the Simple Moving Average 10-15m, the SMA 100-1h, the Fibonacci 61.8% one-week, the SMA 5-15m, the SMA 50-15m, the Bollinger Band 15min-Upper, the SMA 10-4h, the BB 4h-Middle, the BB 1h-Middle, the SMA 200-15m, the SMA 50-1h, the Fibonacci 38.2% one-day, the SMA 200-1h, the SMA 50-4h, the Fibonacci 23.6% one-month, and the SMA 10-one-day.
The long list above keeps GBP/USD tight, but once the pair chooses a direction, there is less resistance on the upside. The upside target is 1.3355 where we see the convergence of the previous monthly high, the Pivot Point one-day R3, and the Bollinger Band one-day Upper.
Looking down, there are quite a few lines that could cushion the fall, with support awaiting at 1.3135 where we see the Fibonacci 38.2% one-month, the SMA 200-4h, and the Fibonacci 38.2% one-week.
This is how it looks on the tool:
Confluence Detector
The Confluence Detector finds exciting opportunities using Technical Confluences. The TC is a tool to locate and point out those price levels where there is a congestion of indicators, moving averages, Fibonacci levels, Pivot Points, etc. Knowing where these congestion points are located is very useful for the trader, and can be used as a basis for different strategies.
This tool assigns a certain amount of “weight” to each indicator, and this “weight” can influence adjacents price levels. This means that one price level without any indicator or moving average but under the influence of two “strongly weighted” levels accumulate more resistance than their neighbors. In these cases, the tool signals resistance in apparently empty areas.
