GBP/USD dropped on the ongoing impasse on Brexit and as the trade war between the US and China deteriorated. Can cable recover? Not so fast?
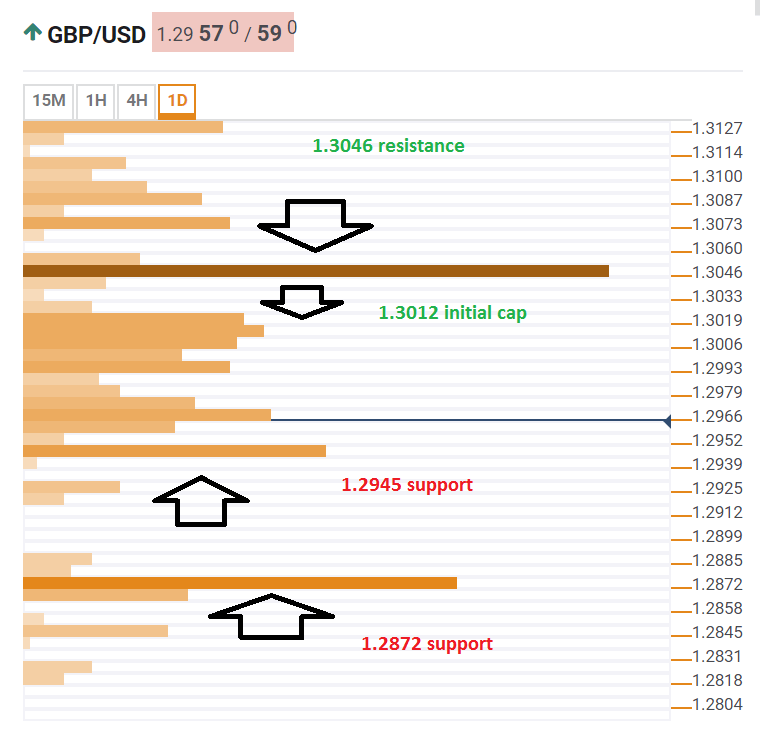
The Technical Confluences Indicator shows that GBP/USD faces initial resistance around 1.3012 where we see a cluster of technical levels including the Simple Moving Average 100-1h, the SMA 5-1d, the SMA 100-1d, the Fibonacci 23.6% one-week, and more.
The most significant resistance line is at 1.3046 where a convergence of levels caps the currency pair. It includes the Bollinger Band 4h-Upper, the previous daily high, the SMA 200-1h, the SMA 50-4h, the SMA 10-1d, and the Fibonacci 38.2% one-week.
Support awaits at 1.2945 where the previous daily low and the Fibonacci 23.6% one-month converge.
However, substantial support awaits only at 1.2872 which is the confluence of the previous monthly low, the BB 1d-Lower, and the Pivot Point one-month S1.
This is how it looks on the tool:
Confluence Detector
The Confluence Detector finds exciting opportunities using Technical Confluences. The TC is a tool to locate and point out those price levels where there is a congestion of indicators, moving averages, Fibonacci levels, Pivot Points, etc. Knowing where these congestion points are located is very useful for the trader, and can be used as a basis for different strategies.
This tool assigns a certain amount of “weight” to each indicator, and this “weight” can influence adjacents price levels. This means that one price level without any indicator or moving average but under the influence of two “strongly weighted” levels accumulate more resistance than their neighbors. In these cases, the tool signals resistance in apparently empty areas.
